Timesheet: Control Your Teams’ Output and Use the Data to Increase Resource Efficiency
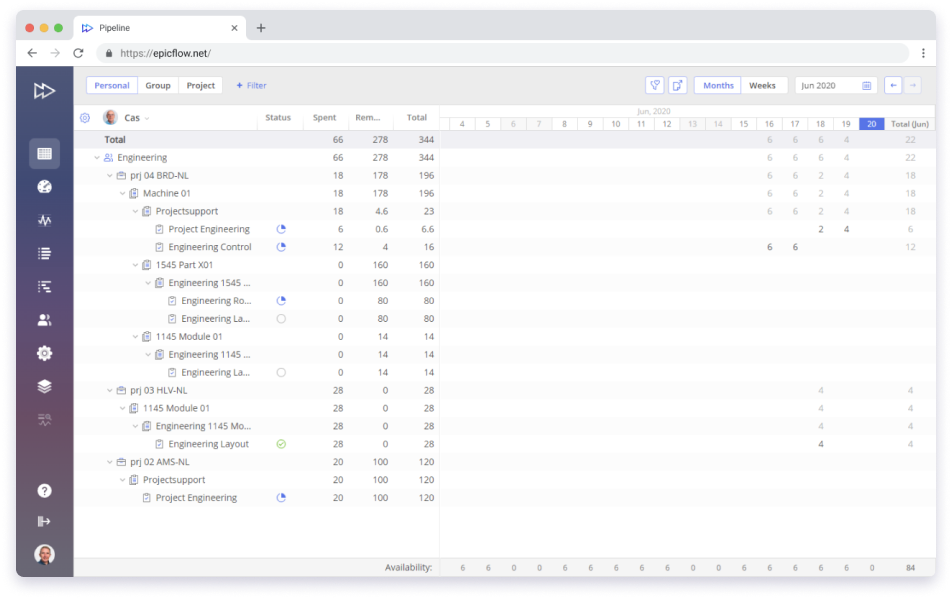
Timesheet provides a detailed overview of the output your team produces day by day and lets you compare your estimations and real results.

Filtering Opportunities
Add and hide filters to make the Timesheet page as convenient for navigation and work as possible. With the filtering feature, you can focus exactly on the data you need at the moment.
In each Timesheet tab, you can use filters to find necessary items quickly and easily:
Item filter
- Name
- Date range
- Summary level
- Task stage
- Tag
- Skills
Project filter
- Name
- Manager
- Status
- Tag
Resource filter
- Group
- Group tag
- User
- User tag
As a User
Mark Your Tasks as Completed and Manage Your Working Hours

It’s important to log your work hours and update this data daily as it’s one of the main prerequisites for high-quality data analysis results in Epicflow.
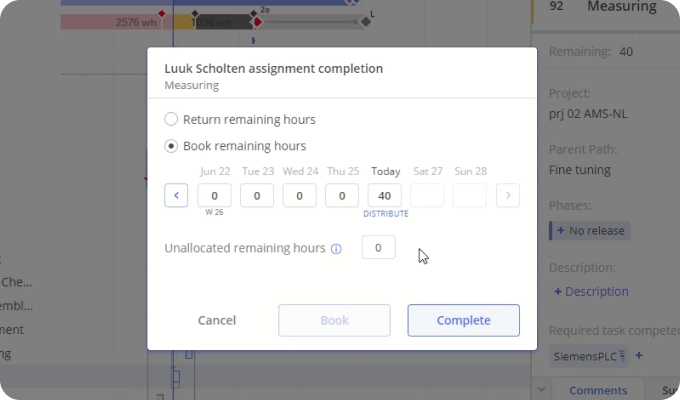
- Complete the task if you’ve used all the time allocated for this assignment.
- Return the remaining hours if you haven’t spent all the time allocated for this assignment.
- Complete a task and distribute spent hours “till today” or “starting from a date” to make the system automatically distribute your working hours based on your availability.
As a Manager
Everything Necessary for a High-Quality Output Analysis: Fine-Tune Your View and Grid

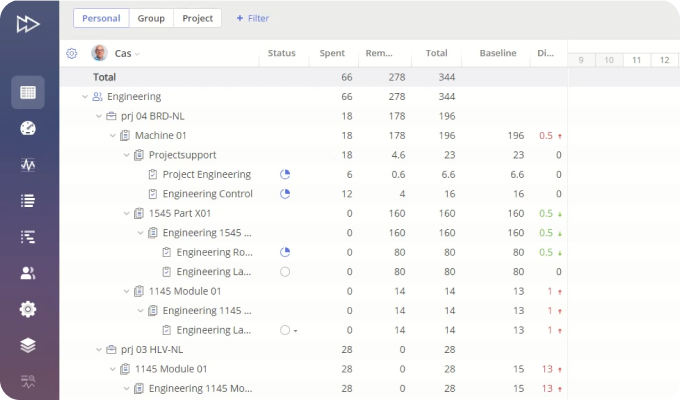
Timesheet provides a convenient way for Epicflow users to review all necessary data. It’s a table where you can choose the columns to be shown and change their order:
-
- Remaining,
- Spent,
- Total Baseline, and
- Difference.
Use Baseline and Difference parameters to examine the way your teams’ real output differs from initial estimations and use this information to improve your project and resource management strategy.
You can choose the way data about resource output will be shown: either weekly or monthly.