

Merriam-Webster’s online dictionary defines “oxymoron” as a combination of contradictory or incongruous words. Cruel kindness might be one example, and virtual reality might be another. Unfortunately, project profit, which is a completely rational concept, is often treated as though it were an oxymoron! Business people always fear big losses on projects.
Ask any project manager how big her project is and you will hear something like: “Well, it’s a ten-month project with a budget of eight million euros.” Great! But why are you doing it? Because you have nothing better to do with your time and resources? Because you need to get rid of all that money?
The implications of this omission are huge – if projects just cost money and occupy time, then who would ever want to do them? Projects become “cost centers,” and everyone knows that organizational cost centers have a much harder time getting resources than “profit centers.” And if projects are cost centers, what does that make project managers? Answer: the first people laid off when the next cash crunch comes!
The truth is that the most important part of any project is usually ignored – why are we doing it? We are doing it because of the value we are going to get from it. And we are going to get that value from the product or service that is delivered at the project’s completion. Shouldn’t that value be identified, estimated, planned, optimized, and tracked?
The fault, Dear Project Manager, lies not in the stars but in ourselves. The three sides of the Triple Constraint paradigm, that triangle fundamental to every project, have never been properly integrated. Project management theory has done an excellent job of dealing with two sides: TIME and COST. But that third side, SCOPE, has long been ignored. Yet it is the most important of the three – because it generates the project’s value.
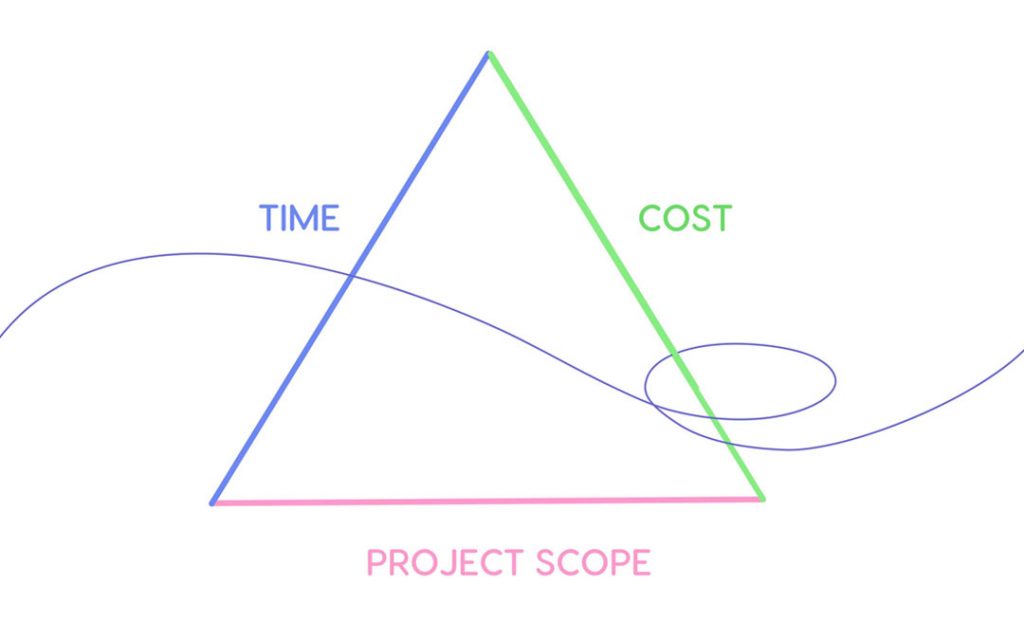
Exhibit 1: The Three Sides of the Triple Constraint Triangle
We have done so bad a job of dealing with that third side that there is not even unanimity on how it should be labeled. In IT projects, it is common to see the third side labeled “QUALITY.” The third side must be SCOPE, whose value is the reason sponsors are willing to fund the work. Quality and other aspects of the scope like durability, usability, etc. are modifying requirements that help guide the scope to optimum value for the cost. Important, yes, but still the aspects of scope.
In the 1980s, project management software packages often were marketed in terms of how well they performed what was called “cost/schedule integration.” This terminology was borrowed from the U.S. Department of Defense’s Cost/Schedule Control System Criteria (C/SCSC), but it was basically a way of saying that, within the software, if one changed the schedule, one could see the impact on cost, and vice versa. Even the best such packages didn’t really do cost/schedule integration, since the cost and schedule are measured in different units: cost in dollars (or sometimes manhours, as project cost is really a measure of resource use) and time in hours, days, weeks, etc. To have real integration to support decision-making, we need a single metric that works for all parameters. And for scope/cost/schedule integration, the metric would have to work for all three sides.
It’s important to remember that, all else (risk, cash flow, community relations, ethical or legal constraints) being equal, NO project sponsor has ever said they want LESS value from a project for their investment!
Quantifying the Project’s Scope
Just as the project itself starts with the reason for doing it, that is where our quest for an integrated metric must also start. If we are undertaking the project scope because of the value (contract price, sales revenue, market visibility, productivity improvement, mortality reduction, etc.) of the deliverable(s), then surely that is how we should quantify the work scope: by the expected monetary value (EMV) we expect the designed scope to generate (or to add to other work!) and that will justify the needed time and resources. For example, if a new remote-controlled lawn mower is expected to generate €20 million in sales for a budget of €8 million, based on certain features and a delivery date of May 1st, that is the most important fact about the project, its very raison d’etre. With that information, we may be justified in investing the time and money necessary to bring the product to market.
This concept seems obvious – what smart investor would sink millions of dollars into a stock without first assessing how much the return is likely to be, what the risk factors are, and whether other stocks might not be more profitable and/or less risky? As we shall see, once a project is being performed, all sorts of decisions will hinge on the answers to these questions. But without doing such an analysis, how can we even start? How do we know that this project, and not another, represents the best investment? How do we know how such risk factors as schedule, technical achievability, or resource availability might impact the potential value of each project in our portfolio? All this is part of the Total Project Control (TPC) approach to project value management. Yet it is amazing how often this analysis is entirely omitted even for projects requiring multimillion euro investments.
Monetization of the expected value of the project scope, whether performed by the project manager, the CEO, the division vice president, the marketing manager, or the contracted customer, should be one of the first steps in the project management process. All other decisions must then be justified based on this value. And, of course, the next step now becomes obvious: the estimated resource use of the project is usually monetized as the COST side of the triangle! And the difference between the value we expect to generate or save, and the money we estimate having to spend to obtain that value is… the expected project profit (EPP)!
With just two sides of the triangle monetized, all other project issues can suddenly be viewed in terms of how, and how much, they affect the project’s “bottom line.” But there is an equally important aspect of such “projectization” of profit. Suddenly, the project’s contribution to the business of the entire organization (either profit or, for non-profit organizations, additional value/services per used resource) is identifiable, measurable, trackable, and expandable. Instead of the project simply aiming for a completion date and budget that has often been plucked from thin air, those controls can be determined based on whether they increase or decrease the expected project profit. Even the individual elements of the project scope, right down to the activity level, can be put to the test: does, for example, a better package design, but one which adds both time and cost to the project, seem likely to increase the profit? If not, don’t do it!
Developing a Fully Integrated Metric: the DIPP
Although monetizing the first two sides of the triangle, SCOPE and COST, provides all the data needed to calculate project profit, every project manager knows that the third side is, in its own way, at least as crucial as the other two. In order to have a truly integrated process, TIME has to be as measurable as the other two, and in the same metric: euros!
Fortunately, we can refer to the Forefather of American Project Management for the answer to this: “Time,” said Benjamin Franklin, “is money!” But how exactly is time money on a project? And the answer is… in any number of ways, depending on the nature of the project. But TIME is always money, in one way or another. It is a plus or minus value, usually an acceleration premium or delay cost, factored into the expected monetary value (EMV) of the project scope.
Although many project sponsors assign that arbitrary metaphor from US Civil War prison camps that’s called a “deadline”, and then assess project SCOPE value as though it were not a variable dependent on TIME, investment value is ALWAYS hostage to payoff date – as future events on projects frequently show! Whatever the project’s EMV, it is based on a specific project completion, or delivery, date. Make that date earlier or later, and the EMV almost always changes. Sometimes a change of one day can change a project’s EMV to zero: a space probe being launched to rendezvous with a comet might miss its window if it’s either a day late or a day early. In other cases, there might be a slight bonus for acceleration, but a big penalty for delay: a toy being developed for the Holiday shopping season may benefit slightly from being in the stores in early November, but lose all its profit margin if delayed into December. A flu vaccine not being administered to a country’s population at the start of the cold weather season will lead to more infections. Project schedules are pliable and must be managed to deliver the greatest expected profit!
There may be cases where there seems to be no benefit from finishing a project earlier: fixed-price contracts with specified delivery and payment dates, and no early delivery incentives. Such situations are distortions caused by either:
- the contracting process, where the separation between the person receiving the value from the product and the person receiving the value from the contract, are evaluated differently (see the “Principal-agent problem“), or
- the fact that the full scope of the project has been decomposed into smaller projects, where the projects for the subdeliverables are not on the critical path of the total project, but actually have some float. Their full value is not generated until other parts of the project are completed.
There are exceptional situations where acceleration adds no value, or even subtracts some. Such scenarios are almost vanishingly rare – but when they do occur, it’s all the more important to recognize this and manage the schedule and resource allocation appropriately, according to its anomalous value profile!
Under the simplest of circumstances, if we recognize that every project is performed for the value generated by its deliverable(s), then, at the very least, finishing the project sooner generates that value earlier, while finishing it later delays receipt of the benefits. Simple net present value principles demonstrate that the monetary value received a week later is less than the same value received a week earlier.
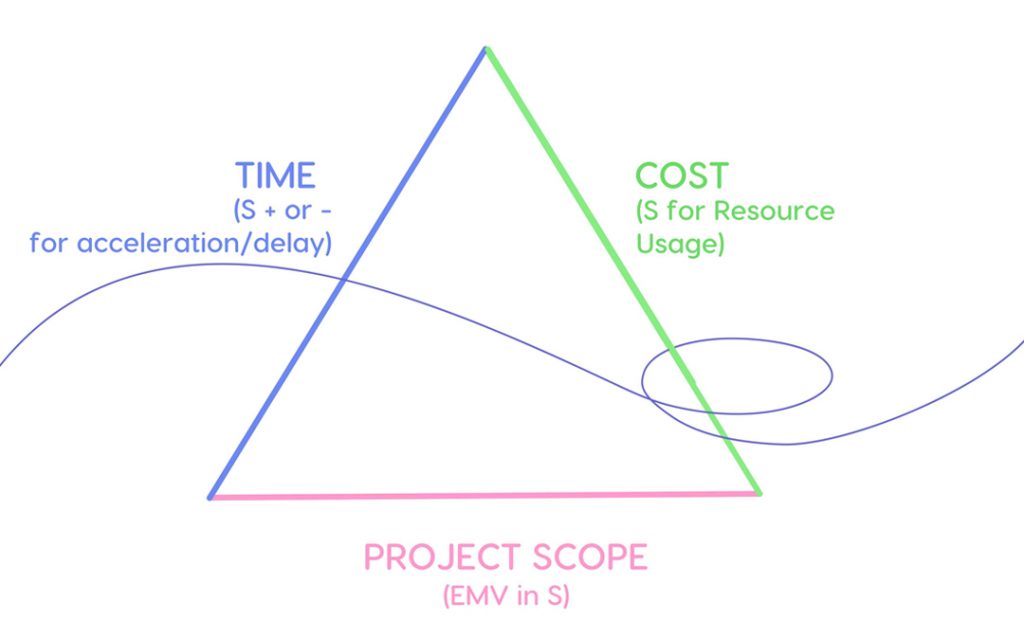
Exhibit 2: Monetizing All Three Sides of the Triple Constraint Triangle
And so we have quantified all three sides in the same unit: euros. SCOPE is EMV euros, COST is resource usage euros, and TIME is the acceleration premium or delay cost euros through their impact on the EMV of the scope. Thus project profit is really:
(€ of EMV + or – € for acceleration/delay) – € of resource cost
In addition, and perhaps even more valuable, this allows us to formulate a profitability index. This index is one that I first proposed in an article published in the September 1992 issue of Project Management Journal, titled: When the DIPP Dips: A P&L Index for Project Decisions. In that article, the DIPP (which stands for Devaux’s Index of Project Performance) was proposed as an index for determining whether to terminate or continue funding an ailing project. What it took me several more years to recognize is that, by quantifying the three sides of the Triple Constraint triangle, the DIPP can be used as a barometer to gauge all project decisions. The formula would be:
DIPP = (€ of EMV + or – € for acceleration/delay) divided by € of Cost ETC
At the start of the project, the Cost ETC is the planned budget. As the project proceeds, work is accomplished, resources are used, and costs accrue and migrate from the estimate-to-complete column to the “sunk costs” column. Therefore, the DIPP should curve steadily upward as the denominator declines. If it doesn’t, or it does not do so as rapidly as expected, it indicates that either the Cost ETC is declining more slowly than expected, or that the EMV has changed. There are many factors that could cause the EMV to decline. One is a change in market conditions. The second one is SCOPE pruning. An even more common explanation, of course, is project delay, which can both reduce the EMV (per TIME delay costs) and prevent the Cost ETC from declining as rapidly as planned.
Whatever the cause, a variance between the planned DIPP curve and the actual one should send a signal that something is wrong. Threshold levels, such as those that are often built in on the earned value indices SPI and CPI, can be built in on the DIPP to allow senior management to oversee the project on an exception basis. This provides an index called the DIPP Progress Index (DPI) that allows the tracking of a project’s most important aspect: its profitability! At any point in the schedule:
DPI = Actual DIPP divided by Planned DIPP
A DPI below 1.0 indicates we are doing worse than planned. A DPI above 1.0 indicates we are doing better than planned! And project teams can seek ways to accomplish this!
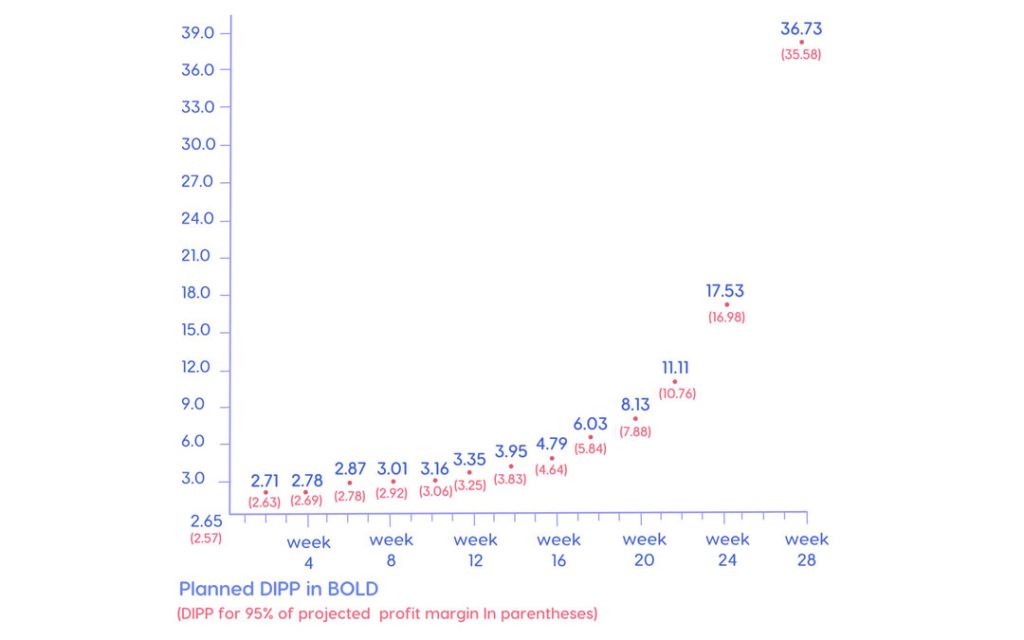
Exhibit 3: Planned DIPP with a 5% Threshold Factor Built-in for Senior Management Control
Tracking Portfolio Profits Through the DIPP
The senior management of a project-driven organization should also be tracking its own DIPP. To whatever extent an organization’s profits are generated by projects, to that extent the organizational DIPP, across the entire multi-project portfolio, is the barometer of profitability, a forecast of the future bottom line. Each portfolio manager should receive regular reports on the DIPPs and other status of each project that the organization is supporting. Such data might be displayed in the reporting format shown in Exhibit 4:
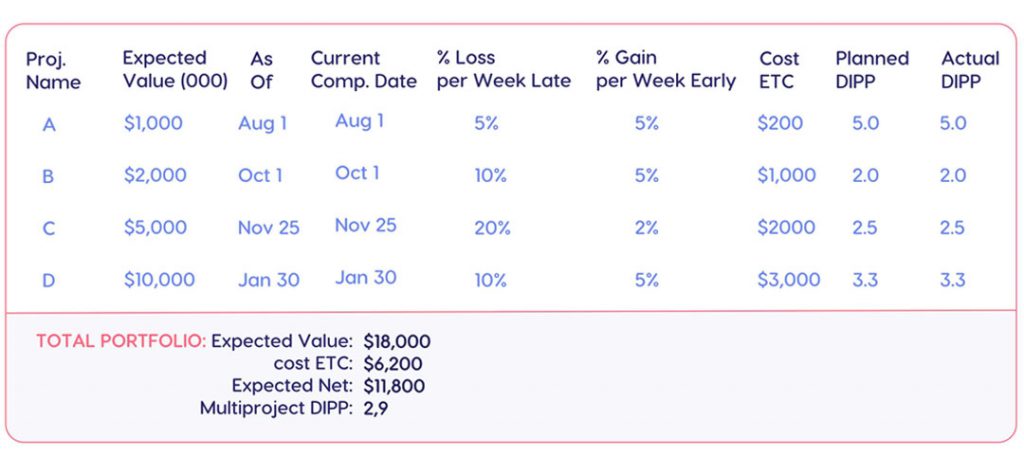
Exhibit 4: The TPC Portfolio Summary Report (with all values/costs in thousands)
With these data, the portfolio manager can track the profits and revenues of each project, and forecast profits across the total portfolio. If each of the project managers is working at the project level to maximize each project’s DIPP, the portfolio manager can be fairly confident that the profitability, for the current investment, is maximized. If any project slips from its current completion date, both its DIPP and the portfolio DIPP should decline. In addition, the portfolio manager can assess requests from project or line managers for changed priorities or increased staffing levels. These are the sorts of decisions that should never be made without assessing the impact on profitability at the organizational level.
The portfolio above seems quite healthy. The potential acceleration gains, especially the 5% per week, or $500,000, on Project D, might stimulate the portfolio manager to work with that project manager to see if additional resources or vendor incentives would be practical. But overall, as long as no delivery date slips, everything seems to be proceeding in an acceptable manner.
However, what happens when a new project is suggested? Perhaps a very profitable one, such as Project E, shown in Exhibit 5:
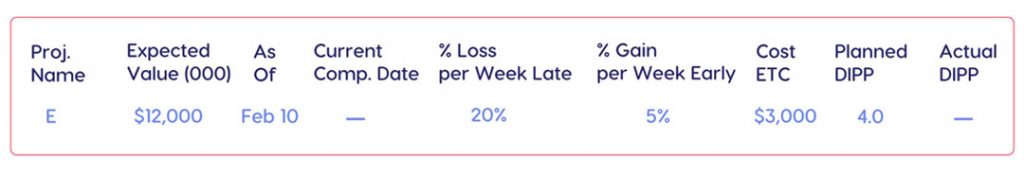
Exhibit 5: TPC Data for Proposed New Addition to the Portfolio
Assimilating a New Project Can Make the DIPP Dip
First, please notice that Project E is not a three-million-dollar project – it’s a nine-million-dollar one! This new mindset of “sizing” projects by the project profit instead of by the budget is crucial both to the process of justifying priorities and resources for this particular project, and for the future stature of project management within both this organization and throughout the industry.
Second, let us recognize that this project is, in comparison to the others in the portfolio, an extremely attractive one. Even without doing the sort of detailed EMV analysis that we would recommend, most portfolio managers would realize the potential value of such a project and immediately mandate its implementation. This scenario occurs every day in every business organization in the world (much to the chagrin of experienced project managers, who if they are reading this will already recognize where we are headed!). However, without access to the complete range of Total Project Control data across the portfolio, such a decision is not only unjustified, but dangerous!
There is only one way that the portfolio manager would be justified in making such a decision: that would be if an entirely new set of resources were dedicated to the new project. But if Project E is going to be dumped into the hopper with the other four projects, accessing the same resource pool, then it can hardly help but impact the rest of the portfolio. And that impact can be so extreme as to offset all the new profits of Project E. If that is the case, of course, and profits decrease, it will be blamed on bad luck or poor project management, rather than the simple lack of adequate data.
Good project management practice mandates that project data must be analyzed across the entire portfolio. The new project must be resourced and scheduled, and the portfolio subjected to multi-project resource leveling. And, unfortunately, when we do this, we discover that Project E, when added to the organization’s limited resource pool, delays all the other projects, with the results shown in Exhibit 6:
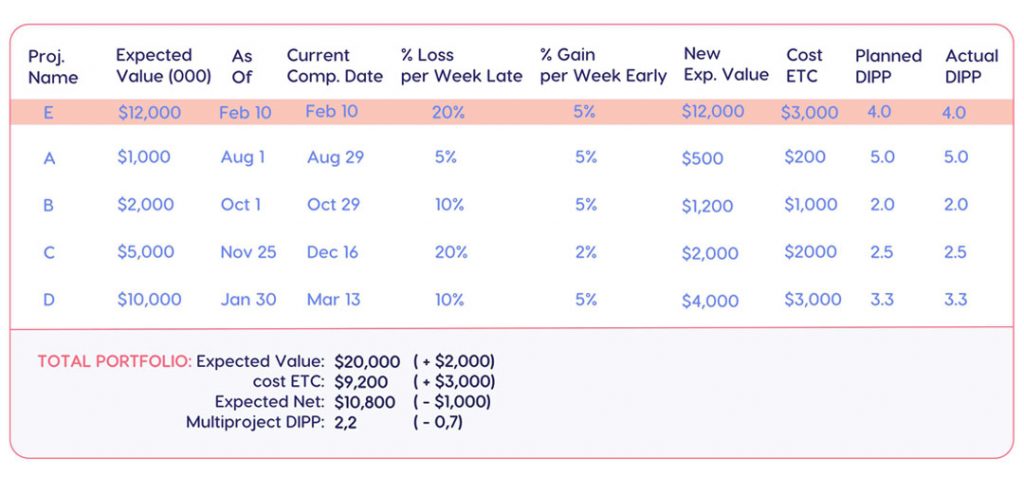
Exhibit 6: The TPC Portfolio Summary Report After Multi-project Resource Leveling
The ability to view such data may be unsettling to some managers. The fact that, for the first time, they can quantify how undertaking an attractive new project will reduce the organization’s profitability (if it is implemented as shown above) may introduce an uncomfortable level of accountability. However, the fact of the matter is that this is what would have happened anyway, without the TPC Portfolio Summary Report. Additionally, the TPC data will show how any changes in the above data items will impact potential profits.
In other words, there is now a yardstick that will allow the portfolio manager to adjust the individual projects and resources, using the DIPP and profits as a barometer to ascertain a more profitable project profile.
Critical Path Drag and Drag Cost
We have thus far discussed project profitability at the project and portfolio levels. But just as portfolio profitability requires data and management at the project level, so too project profitability often requires drilling down to the activity level. Fortunately, new scheduling innovations are available to help target adjustments, in scope, schedule, and resources, to those activities that will generate the most benefit. The full range of these data is outside the scope of this paper. But the simplest new data item to comprehend (if not to calculate!) is critical path drag (originally DRAG, an acronym for Devaux’s Removed Activity Gauge).
Critical path drag is sometimes described as being the opposite of the standard scheduling metric total float (TF): it quantifies how much time each critical path activity is delaying the project’s completion. These are the data that are not provided by most standard CPM scheduling software. Yet it is a hugely important metric when trying to identify those activities whose compression, either by resource increase or scope reduction, would most benefit the individual project. Drag data can help point the project managers in the right direction, but most project managers would be hard pressed just to determine which activity in the network logic diagram in Exhibit 7 is causing the most delay, never mind how much. Notice that the information in Exhibit 7 is the totality of what most project management software packages provide to support schedule compression. Yet even with just 22 items and no lags or complex dependencies, it’s not easy to see where to focus our schedule compression efforts.
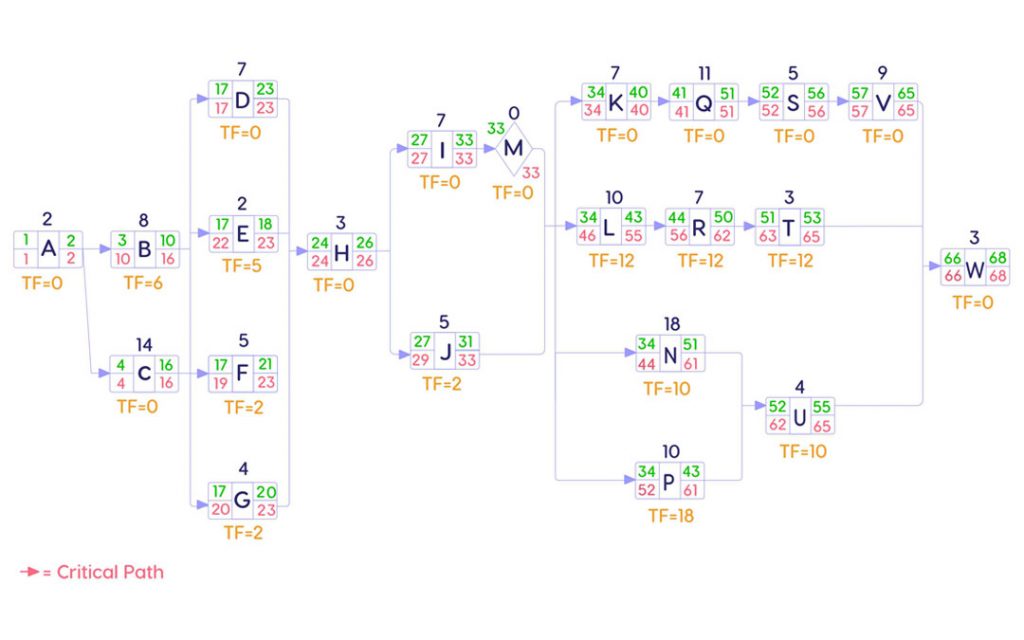
Exhibit 7: A CPM Network Logic Diagram Displaying Traditional Data
Fortunately, Exhibit 8 lists the drags of the critical path activities in descending order, as potential for schedule compression.
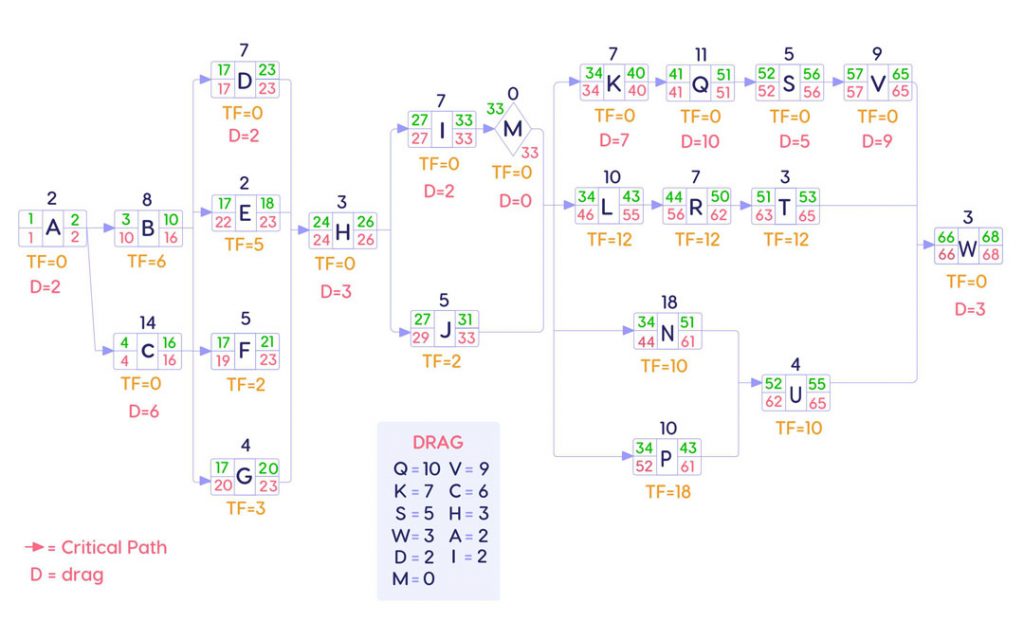
Exhibit 8: A CPM Network Logic Diagram Displaying Drag Totals
The drag calculation shows that Activity Q is adding 10 days to the project, more than any other task. Shrink Activity Q’s duration from 11 days to zero and its path (K-Q-S-V) would be 11 days shorter, at 21 days. The second longest parallel path, N-U, has a duration of 22 days, and so would now become the critical path with the drag of 1 day. Each activity on the path K-Q-S-V would now have a total float of 1 day. And the project would be completed 10 days earlier, on Day 58. That is why Q had 10 days of drag – it was adding 10 days to the project duration.
If this were Project D, and each five-day-week of delay beyond January 30 (or beyond Day 58 in the schedule in Exhibit 8) represented a reduction in EMV of $1 million, the drag cost of Activity Q would be about $2.0 million. Surely at that price, something could be done to remedy this? And if not, how about Activity V (9 days of drag at a drag cost of $1.8 million), or K (7 days of drag at a drag cost of $1.4 million)?
Generating a More Profitable Portfolio Schedule
Once the value data is properly assembled, other data items such as resource costs, risk to quality, and measures of an activity’s resource elasticity can help the project managers, working under the guidance of the portfolio manager, to optimize each project’s plan. Ultimately, a new multi-project profile, suggested by the TPC data, can help to generate a new, more profitable, portfolio profile, as shown in Exhibit 9:
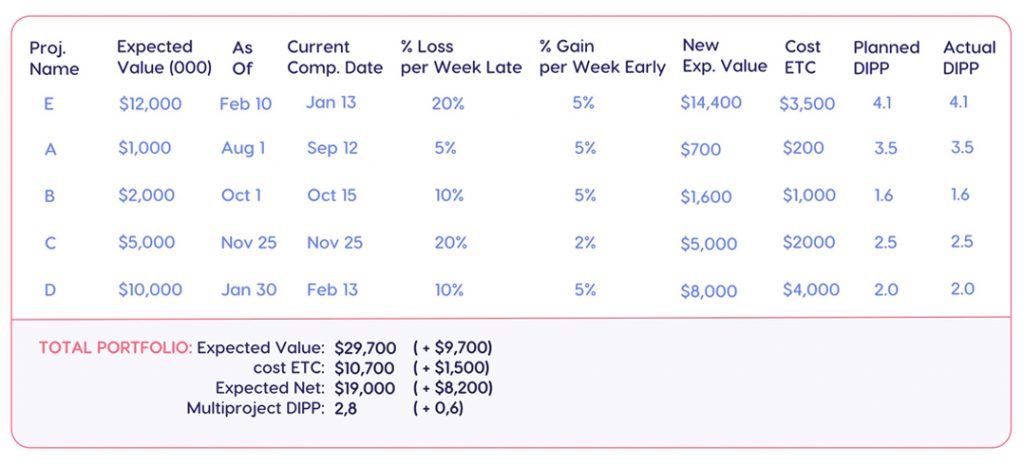
Exhibit 9: The TPC Portfolio Summary Report After Project-level Adjustments for Optimized Profit
Exhibit 9 shows that even though adding resources to the activities with the high drag cost will increase the budgets for Projects D and E by a total of $1.5 million, we’ll be increasing their EMV even more, and this should generate $8.2 million in additional profits. Would this be the optimum profile? Is the cash flow available to increase expenditures in such a way? Such questions can only be answered through further analysis. But now at least the data are there for such analysis, across scope, schedule and cost, as well as across all projects in the organizational portfolio.
And, perhaps most important, the project managers, and project management itself, have demonstrated their value by finding a way of adding $8.2 million to the organizational coffers.
Finally, it is important to point out that a project management software system with a robust AI-driven multi-project resource and scheduling system, guided by the portfolio DIPP, would be capable of optimizing organizational value by doing all of the above.
References
Books:
Devaux, Stephen A., Managing Projects as Investments: Earned Value to Business Value, CRC Press, 2015.
Devaux, Stephen A., Total Project Control: A Practitioner’s Guide to Managing Projects as Investments, CRC Press, 2015.
Articles:
Devaux, Stephen A., “When the DIPP Dips: A P&L Index for Project Decisions”, Project Management Journal, September 1992, Pp. 45-49.
Devaux, Stephen A., “The Drag Efficient: The Missing Quantification of Time on the Critical Path”, Defense AT& L Magazine, Feb 2012
Duncan, William & Devaux, Stephen, “Scheduling Is a Drag”, ProjectManagement.com, Jan 15, 2009.
Related LinkedIn Articles by Stephen Devaux:

