In the previous article, we showed you Task List updates. Apart from the comprehensive view of all task-related data on different levels and from various perspectives in the Group tab, you can also analyze your employees’ workload and detect bottlenecks with our new features: Load Analysis, Inactive Analysis, and Bottleneck Analysis. Let’s start with the explanation of a bottleneck and its effect on the project workflow.
What's a Bottleneck and Why Is It Dangerous for Your Environment?
- together with the delayed work, this can lead to missed project due dates;
- overloaded resources are stressed, their productivity drops, which can result in burnout.
This is why one of the essential rules of the Epicflow approach to resource management is “Make sure not a single resource is overloaded”.
Before we overview the new features that let you quickly and easily analyze your resource groups’ workload, detect bottlenecks, and remove them from your workflow, let’s recall what functionality is used to find bottlenecks in Epicflow.
How to Find a Bottleneck with Epicflow
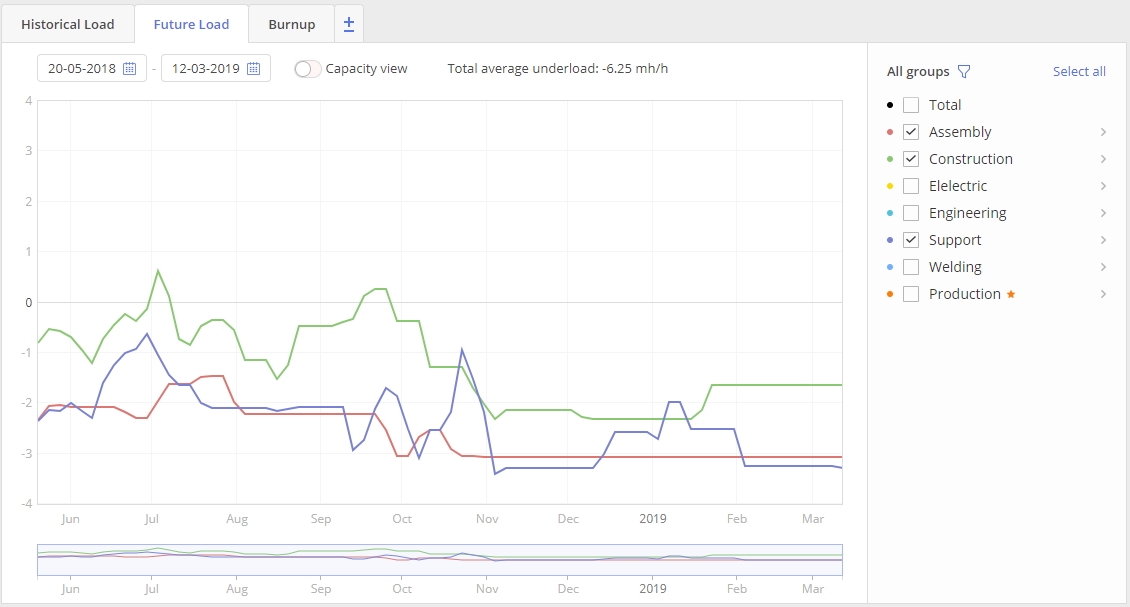
- If the graph is under the zero line, the resource or the group is underloaded (has less tasks than they are capable of doing),
- If it’s over the zero line, they’re overloaded (can’t cope with their tasks), which means there’s a bottleneck hampering your workflow.
Load Analysis and Bottleneck Detection: Find the Tasks Overwhelming Your Resources and Take Measures to Balance the Workload
Epicflow team has developed three essential features that will help you analyze the workload of your resources, predict and avoid bottlenecks: Load Analysis, Inactive Analysis, and Bottleneck Analysis. All of them are available on the Future Load graph, which in turn now can be opened either from the Pipeline or the Task List’s Group tab. From both places you can analyze the load of individual resources and resource groups and check the projects and tasks that are causing the overload. What’s important, the analysis is carried out automatically, and you don’t have to make any calculations. It can be done with a few clicks. Let’s consider the new features in more detail.
Load Analysis
With the Load Analysis feature, you can get information about the tasks and projects they belong to, which are overloading your resources or resource groups. You can further use this data to balance workload by moving milestones or reassigning the tasks to other employees or groups. You can choose one or several groups and check their workload on the Future load graph. Then just select the period on the graph where you can see overload of the chosen group and ask Epicflow to perform a load analysis.
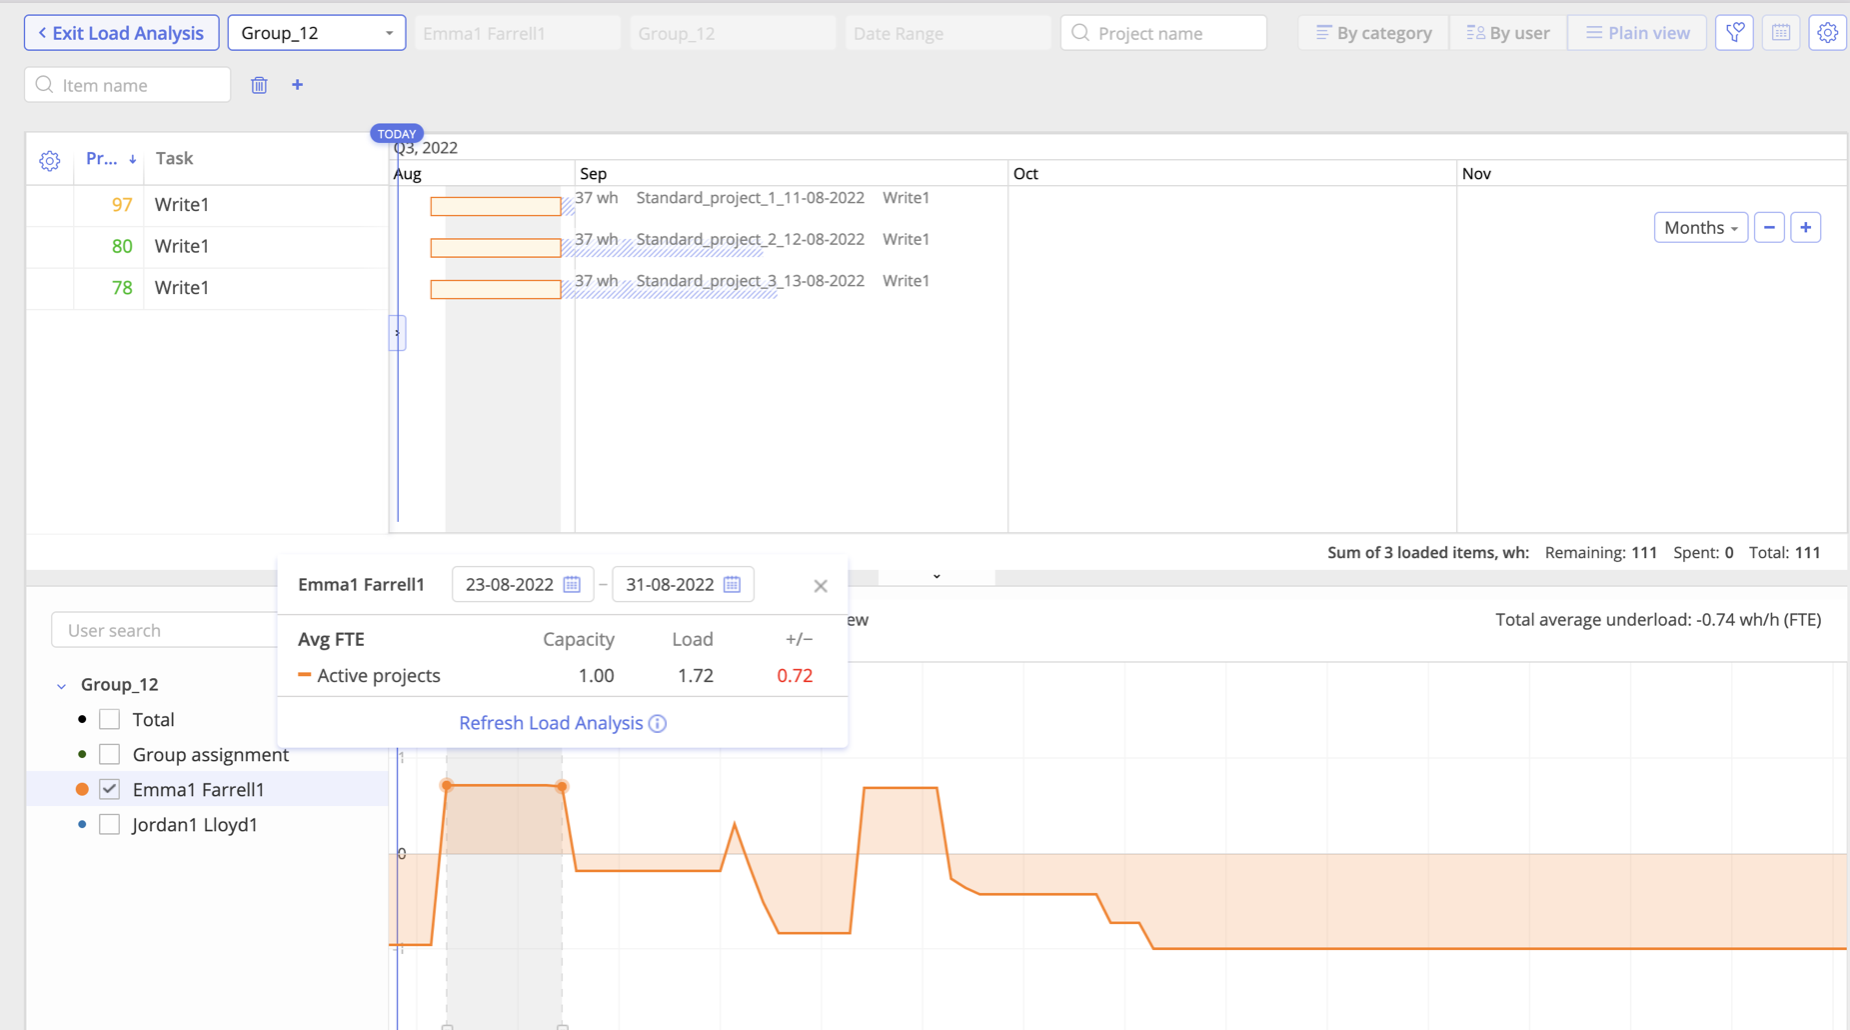
In a couple of seconds you will see the list of tasks (with all related information) overloading the resource/group. At that, you can switch between the modes (plain, category, user) for a detailed analysis.
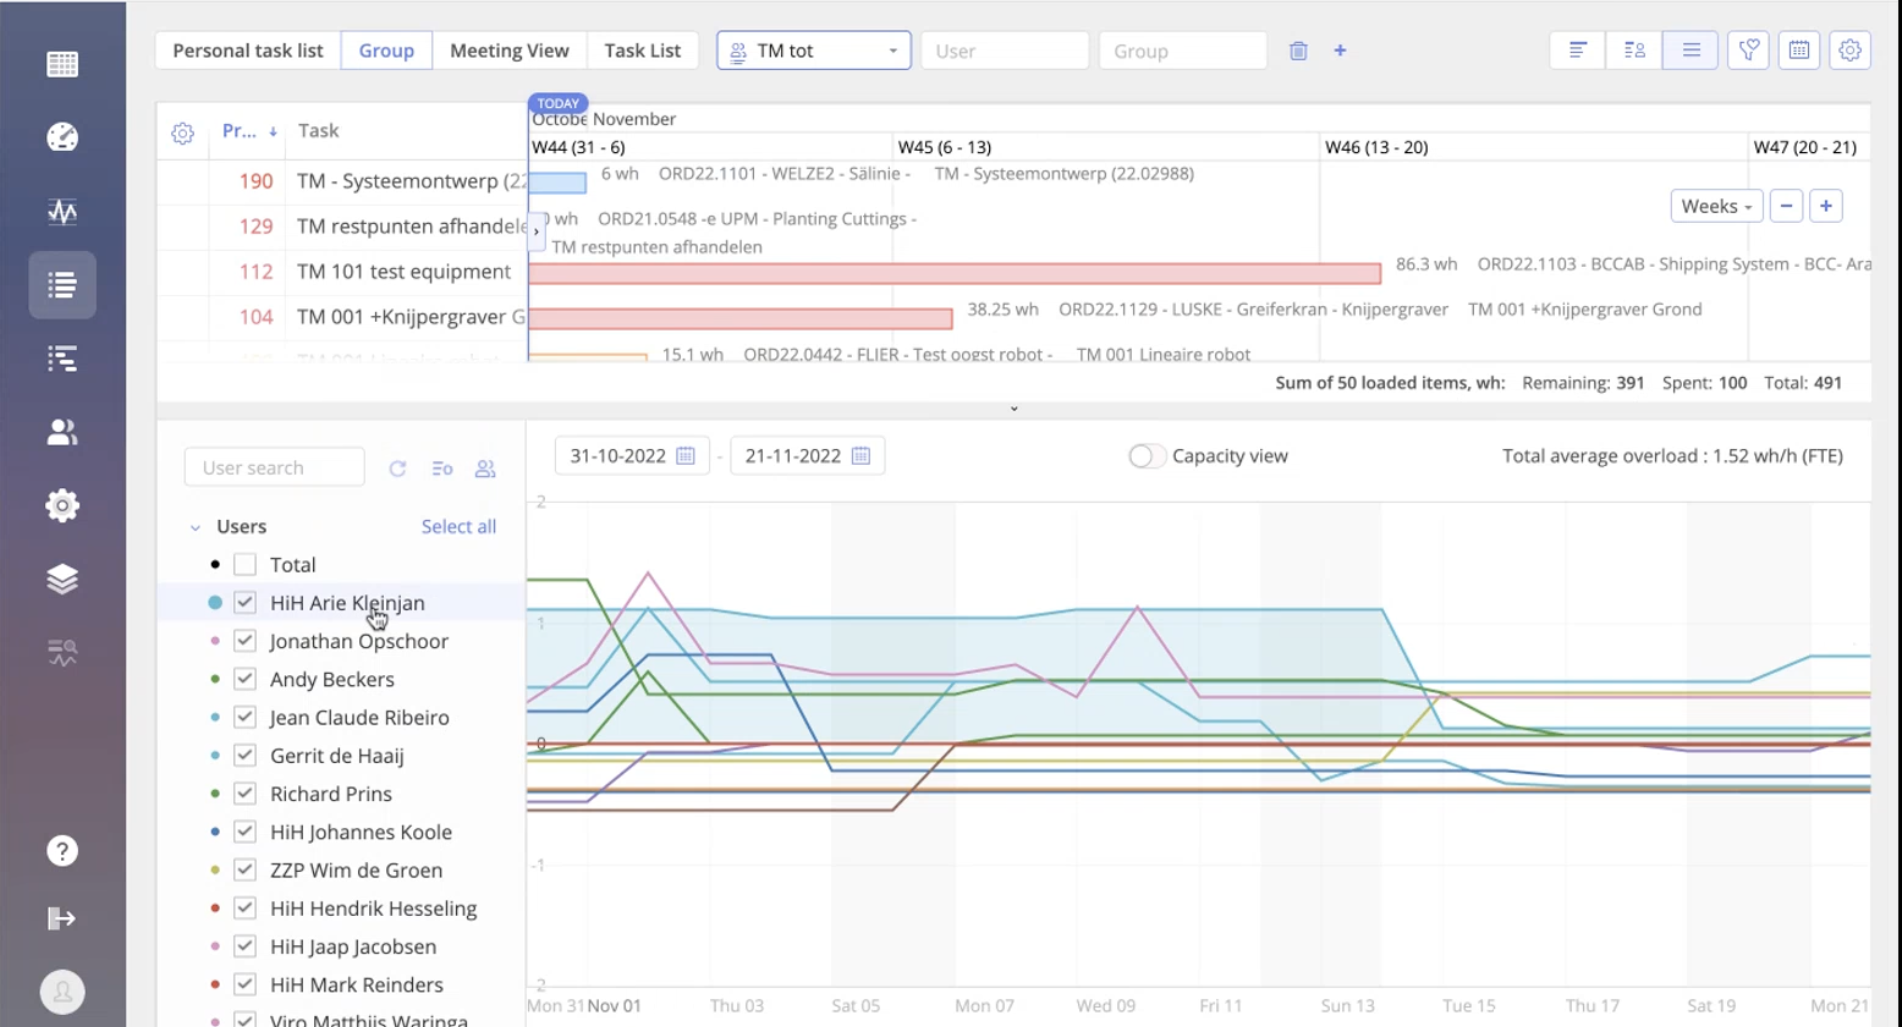
You can move milestones to balance the workload of the overwhelmed groups. Besides, from this page, you can jump to the Task Card to see what competences are required for its completion and find an available resource with the same skills to reassign this task to (within the selected group or outside this group).
Watch a video to see Load Analysis in action:
Bottleneck Analysis
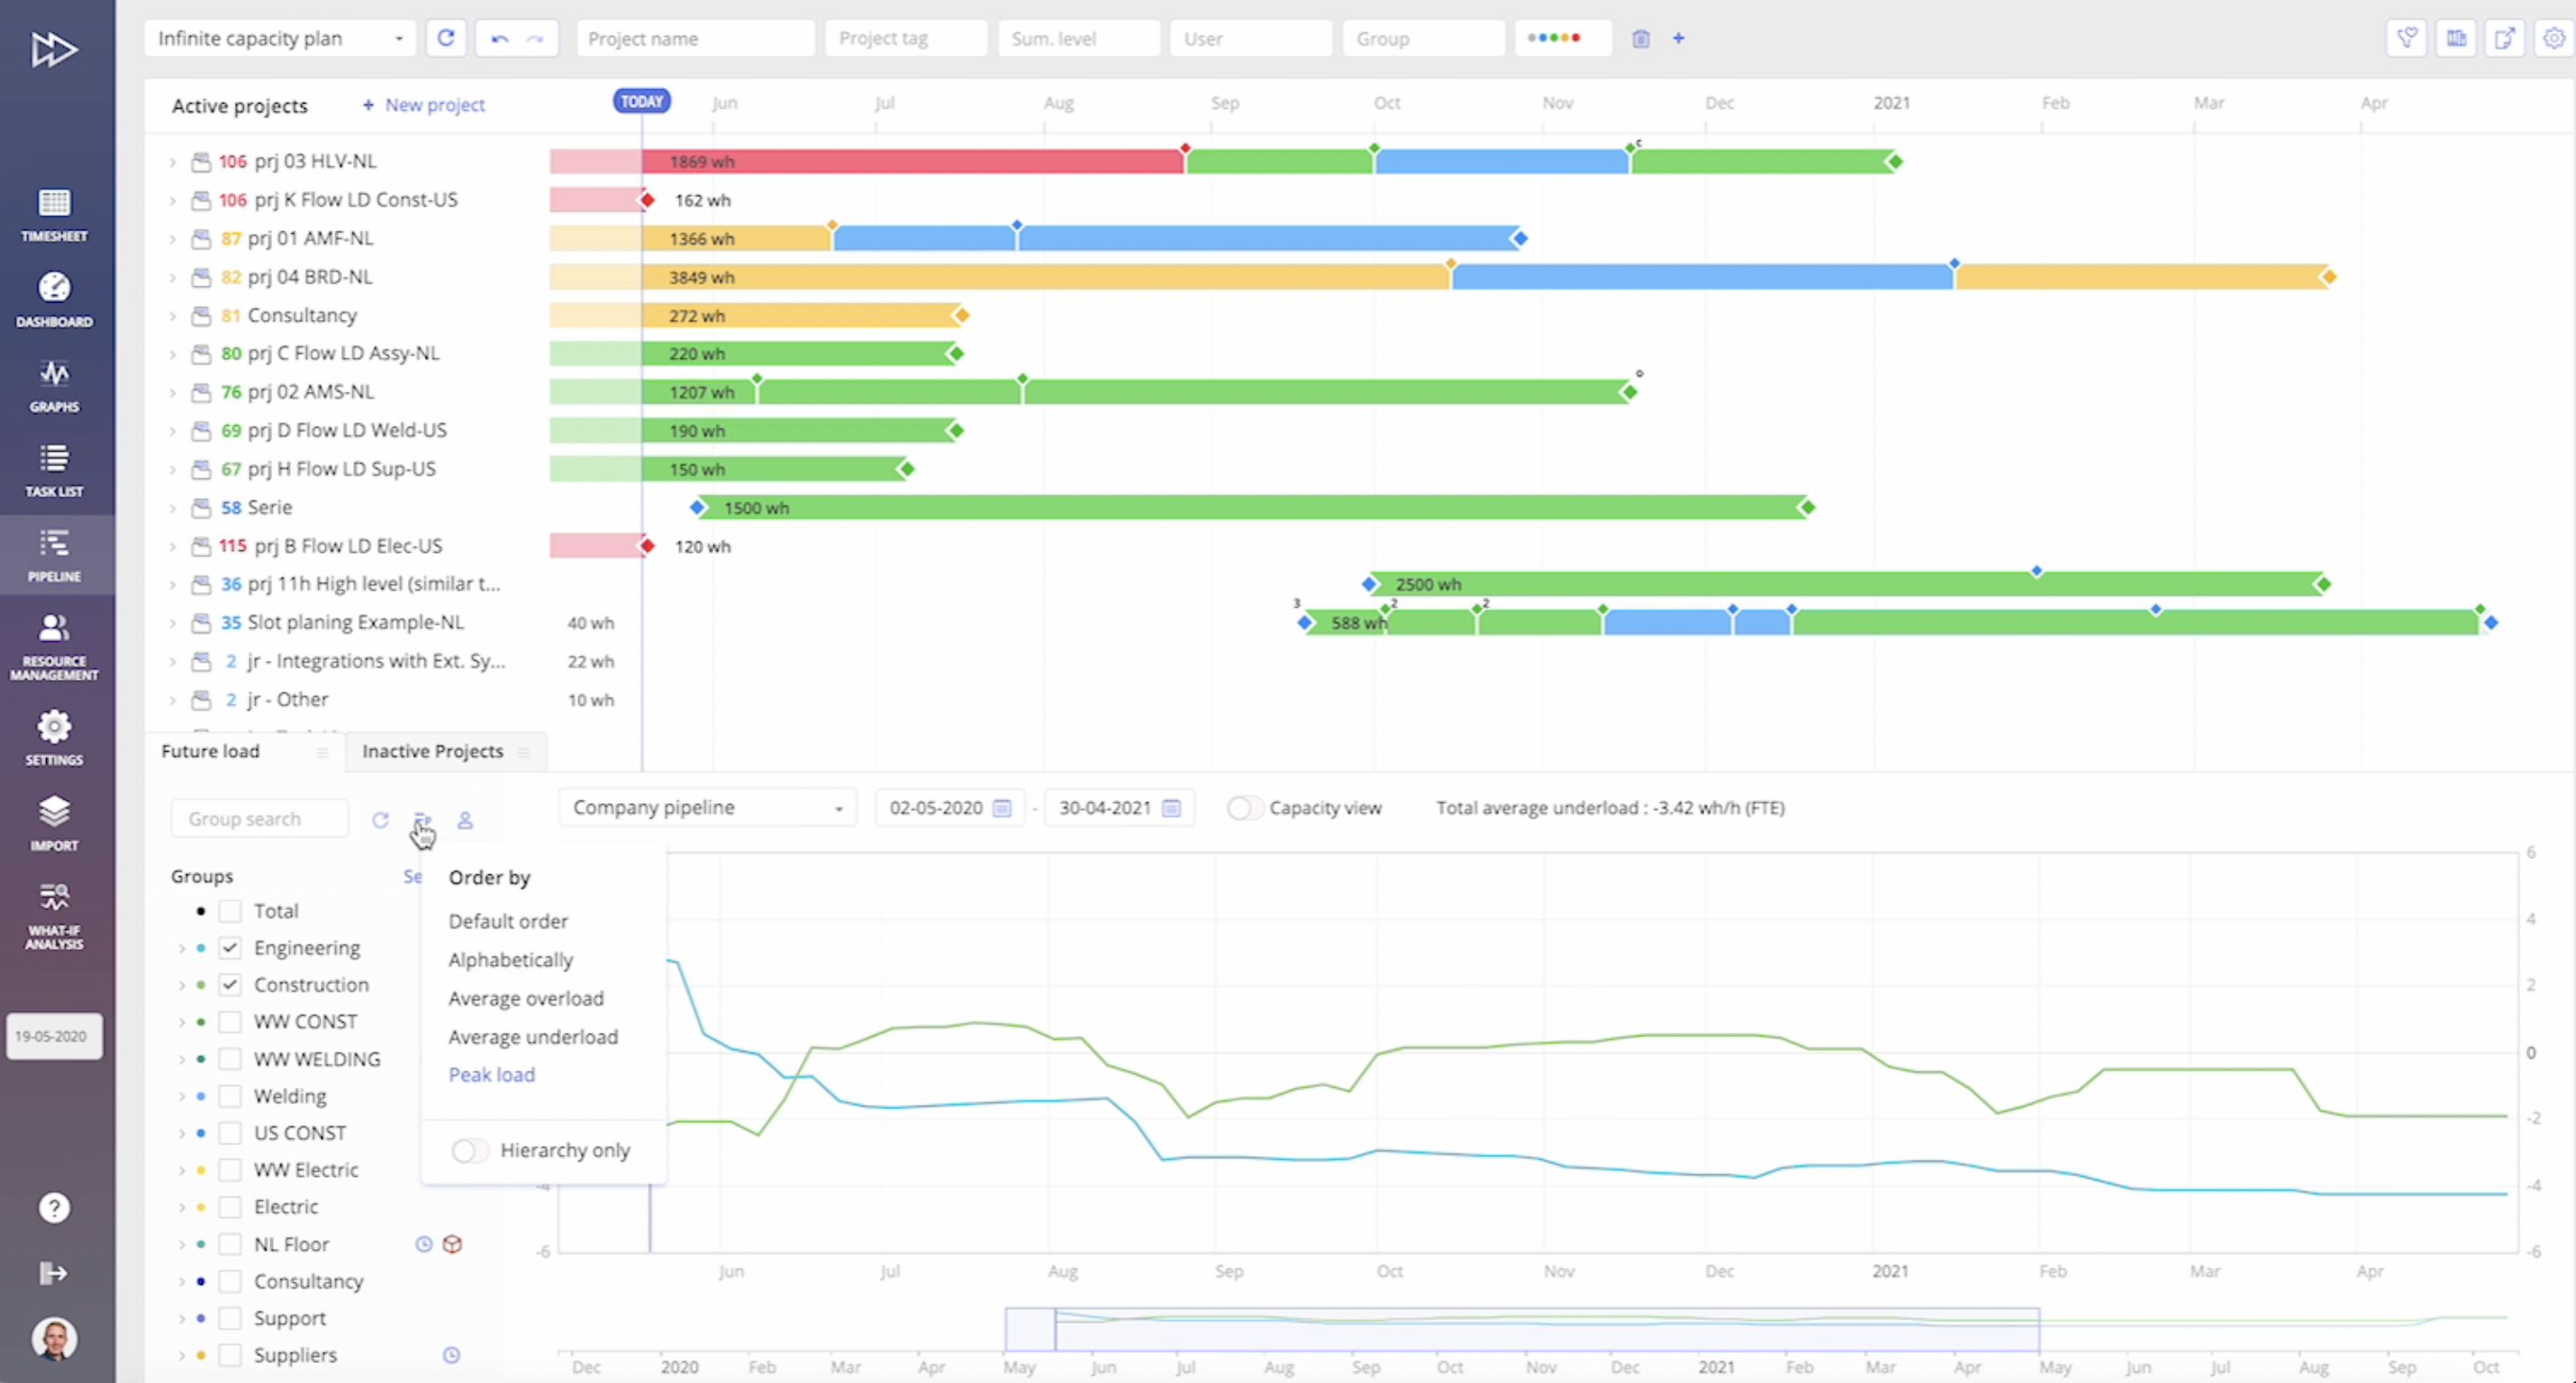
With this feature, you can not only see how loaded your resources are within the chosen timeframe, but check the most overloaded one(s) and take measures to eliminate this bottleneck(s). You can order groups by the criteria as shown in the picture below:
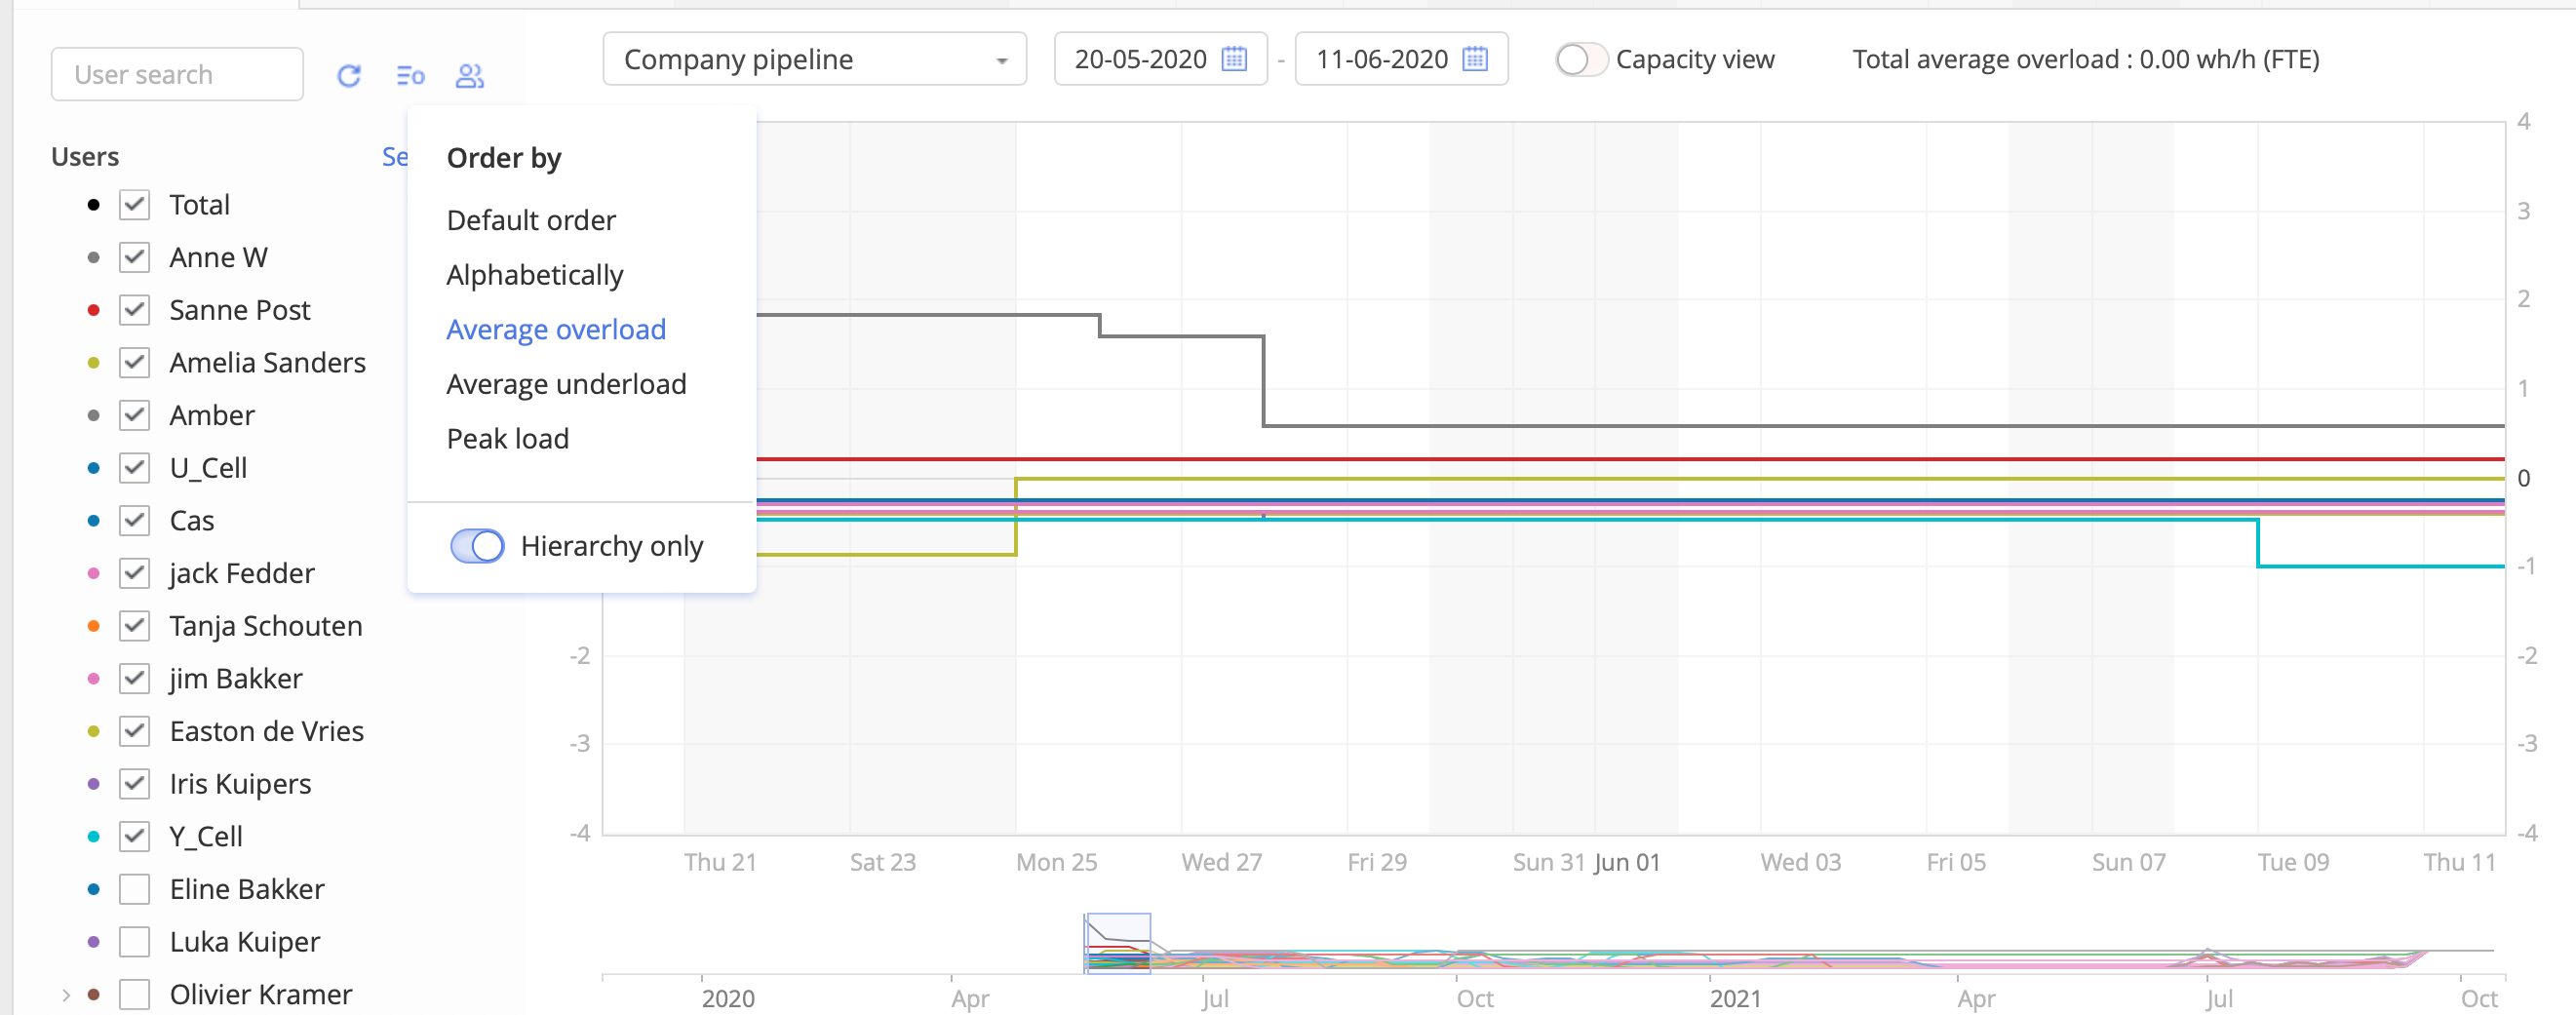
As you can see in the picture, when the load of multiple resources is shown, the graph may look rather messy, which complicates the analysis. To understand what is overwhelming your most loaded employees, you can order deselect all and then select only one or several groups from the top (the most overwhelmed ones). Take a look at the picture below.
Now you have a clear view of your most loaded groups and can make the Load Analysis and then takes measures to balance it. Having reviewed the tasks that are overwhelming your resources, you can either move a milestone and see if this helps avoid overload in the future or open a Task Card of the most constraining task and go to the Resource Allocation Advisor to find another resource or a resource group for it (the one who has necessary competences, capacity, and is currently available). It also may happen that there are no suitable resources for the task in the group, so you can look for another resource outside this group.
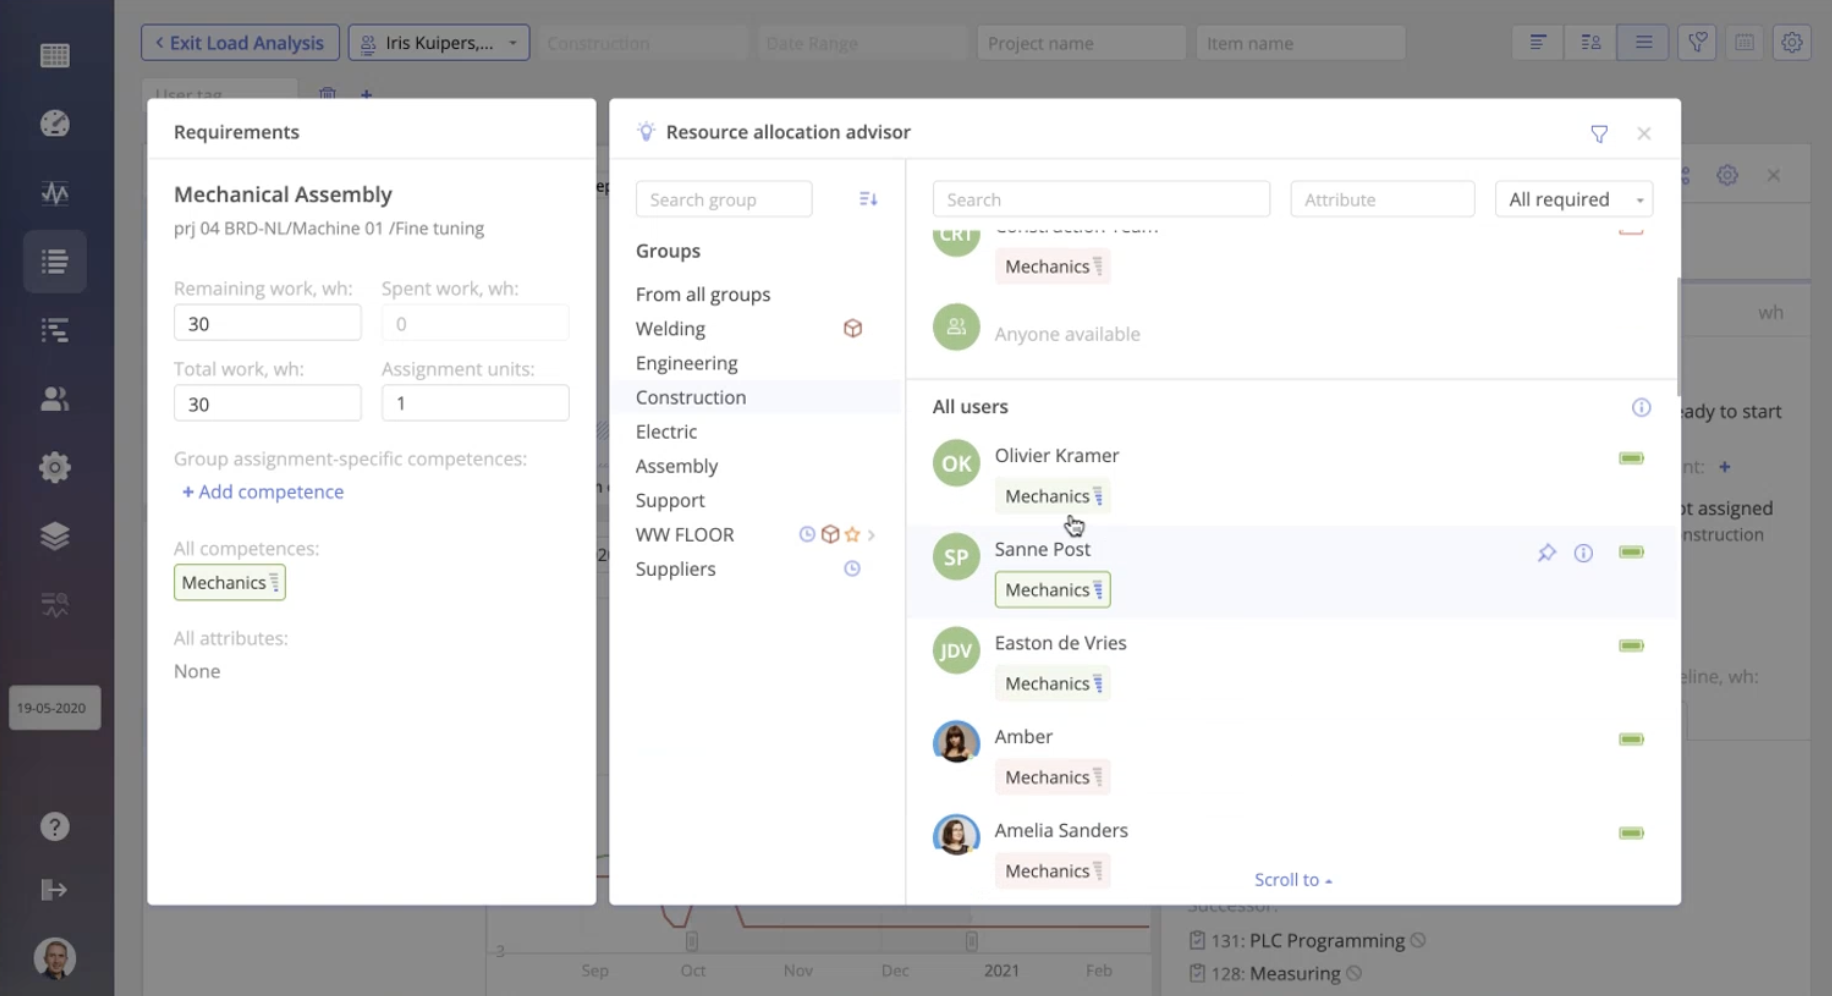
Watch this video to see Bottleneck Analysis in action:
Inactive Project Load Analysis
Besides, now Epicflow users can make a more detailed load analysis involving inactive projects. The Inactive Load Analysis feature makes it possible to see how loaded your resources will be in the future if you initiate them. You can filter your resource groups to see how exact group or individual resource will be loaded by the new amount of work. Take a look at the picture below.
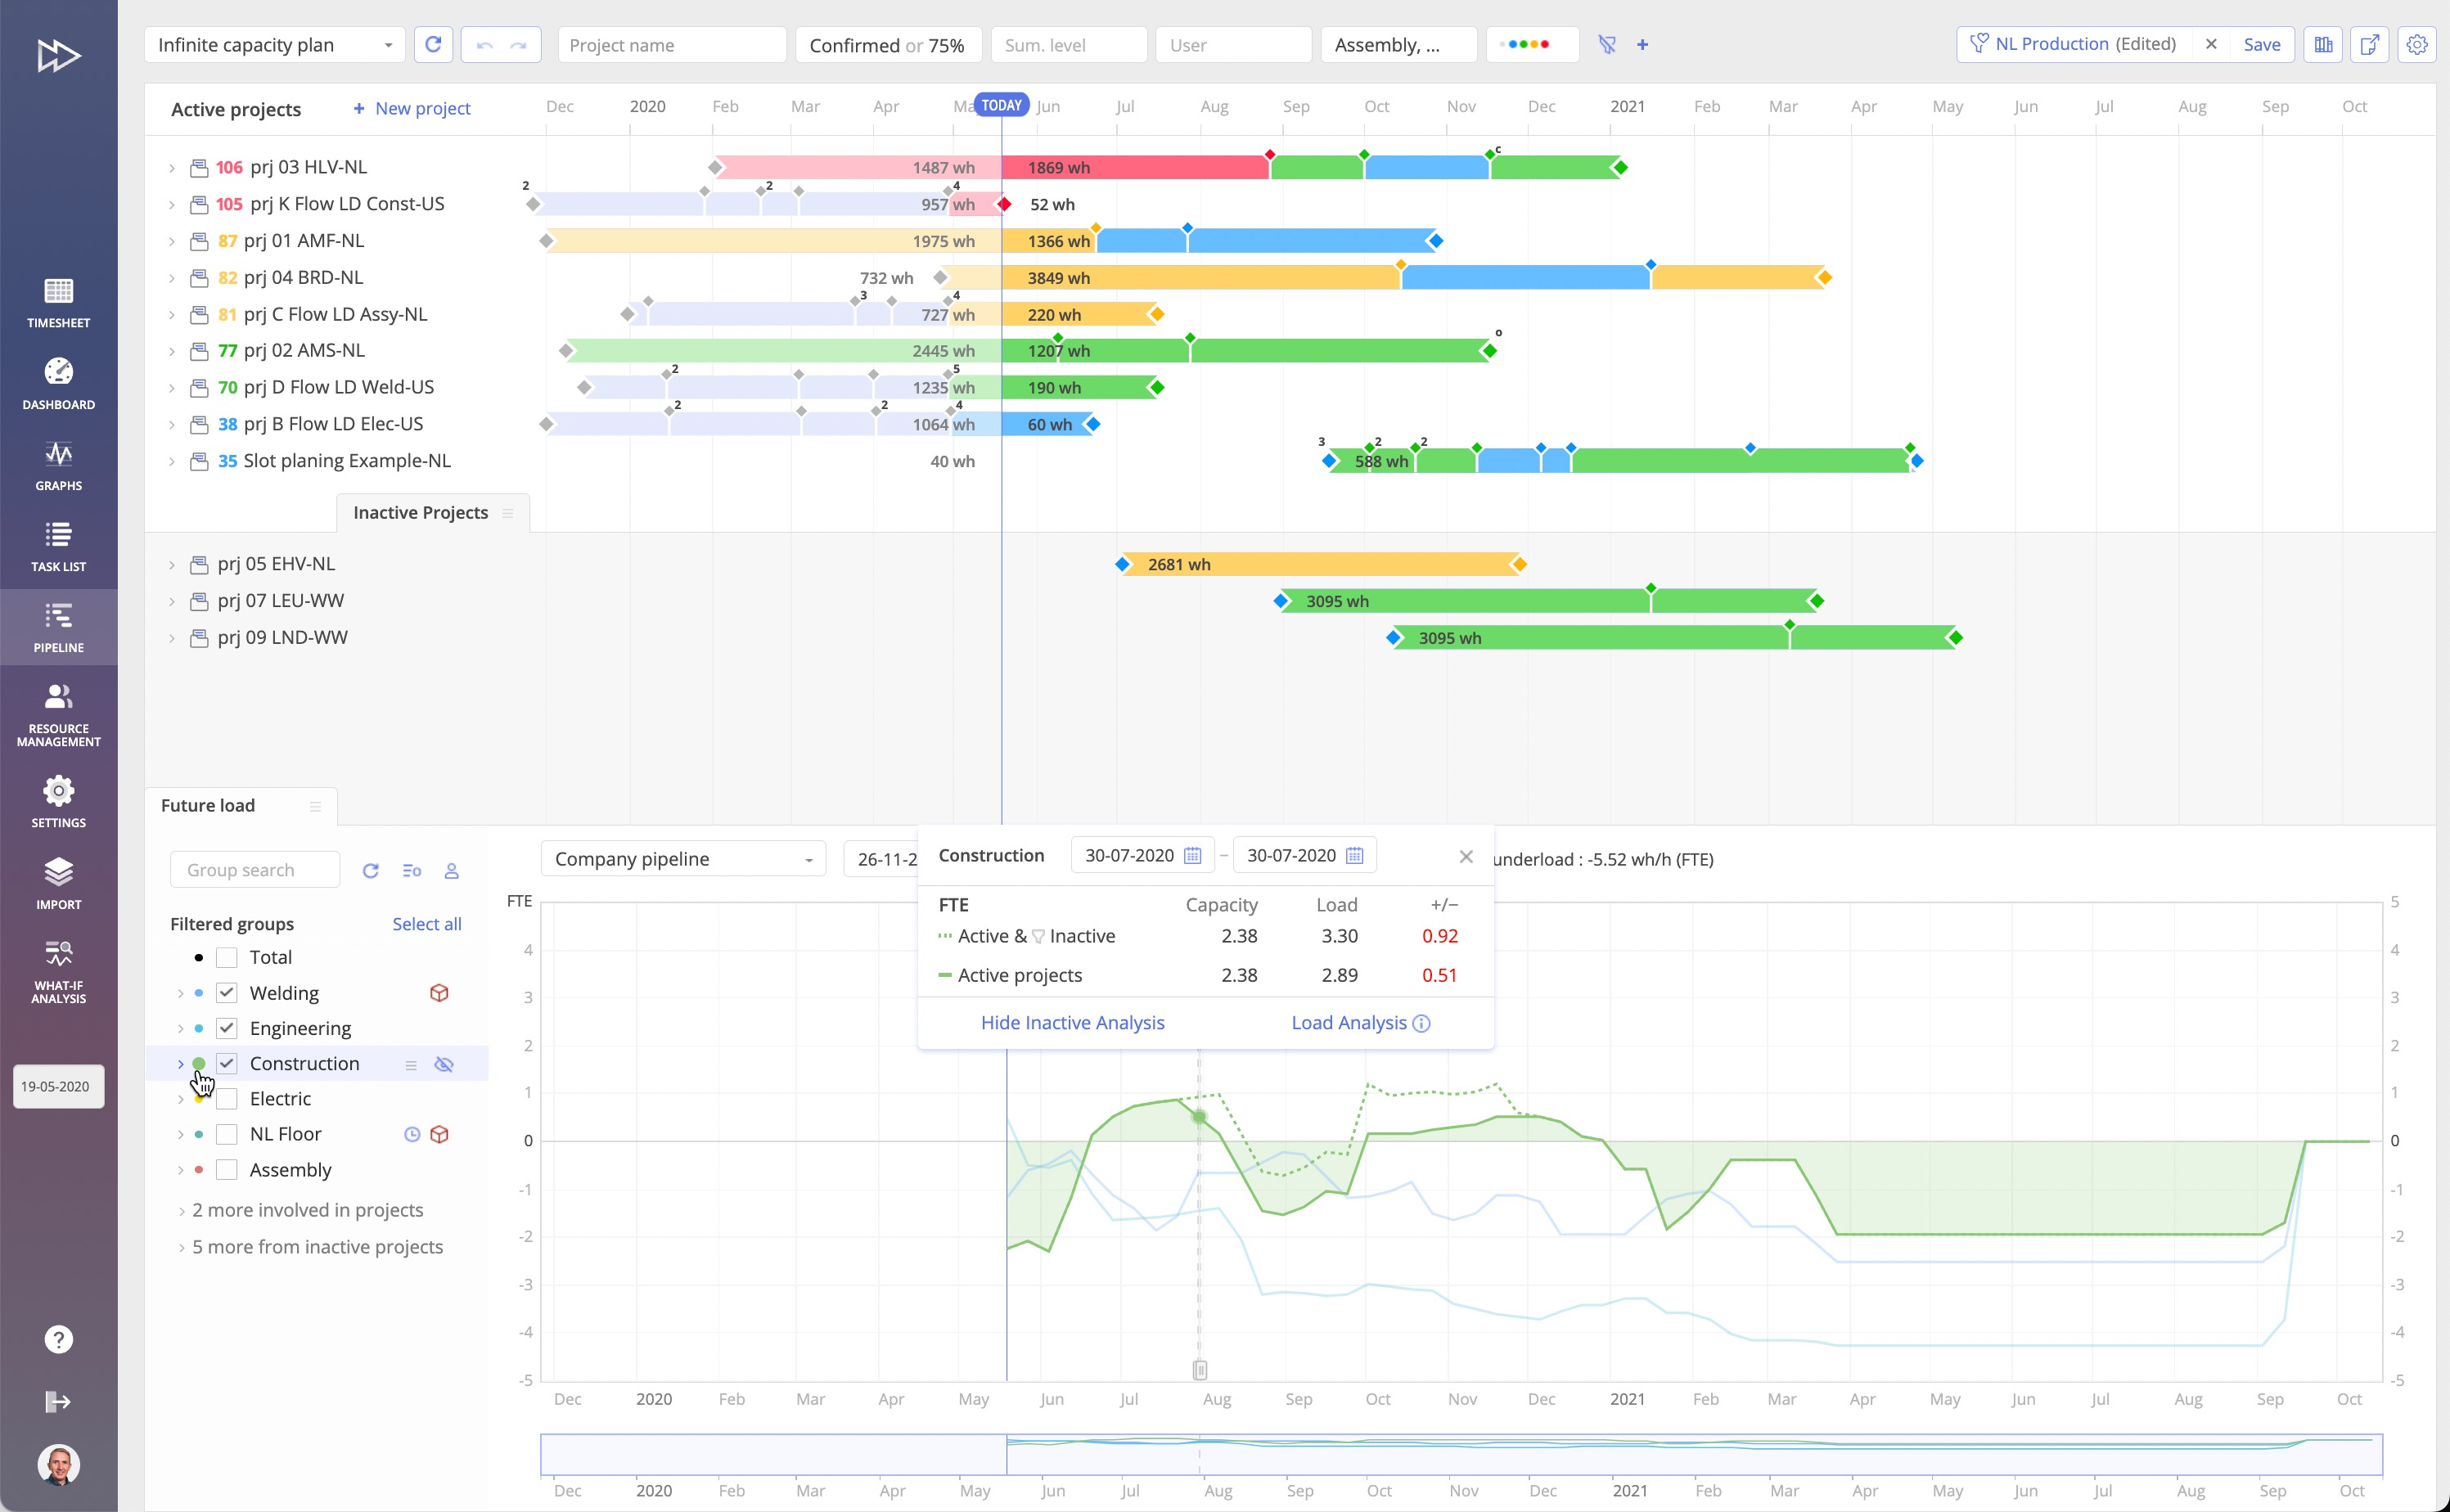
The load created by the inactive projects is presented by the dashed line on the graph. All necessary calculations are presented in the Load Analysis box. As you can see, we’re lacking 0,51 FTE with the active projects running together, and if we initiate the inactive projects, the figures will increase to 0.92 FTE. This means that we don’t have enough capacity in the selected group to cope with the demanded scope of work. If details of the inactive project are available, you can check what tasks are expected to overwhelm your resources and take measures (move milestones, reassign tasks, or hire extra resources) to avoid the bottleneck.
Watch this video to see Inactive Analysis in action:
To learn more about our new features and to see Epicflow in action, don’t hesitate to contact us or book a demo at your convenience.

