How long does it take you to make a project decision? And are you always satisfied with the decisions made?
There’s no doubt you’ve ever had difficulties in doing that, and not all your decisions had positive results. And the reasons for that can vary: either it’s lack of information or improper data, or maybe incorrect analysis or prediction, or all in one. Let’s try to grasp why we sometimes fail in making efficient decisions and why we cannot do it as quickly as we would like.
Decision-Making Foundation
Despite the fact the first version of MS Project was released back in 1984, only 22% of companies utilize PM software tools, according to 2018 Wellingtone survey. For 55% of institutions, real-time KPIs are unavailable, which negatively affects their decision-making processes. 50% employees spend several business days making reports gathering necessary information. Can you imagine if accountants would still perform everything manually? Why 78% of companies decrease their efficiency and slow down their performance without realizing this?
The core of making a decision is information analysis. In project management, any decision made by a project manager is a result of a profound analysis based on reliable information and gained experience, with an insight into the future. Any accurate information can be associated with the past, present, and future.
Past
So, going beyond project management but keeping it as a basis, let’s comprehend why information about the past is so important for making decisions in the present time. Any previous experience is either a good or bad lesson, i.e. it’s a set of knowledge, rules, conclusions, and data in general about the outcomes of one’s previous actions. To succeed in the present and future time, you have to analyze your experience and consequences of your previous decisions.
Present
What about current information? Its necessity is obvious: you cannot do anything if you don’t know the environment. E.g., you can’t make a decision to buy a car if you don’t know its characteristics, whether it’s new or used, its color and model, as well as prices for it from other sellers. Well, theoretically you can, but obviously such a decision is imprudence. And let’s imagine you have several things to decide upon. There is ambiguity: what issue should be tackled first, and which one second? Without full information and a clear idea of the tasks and processes, such a decision is very difficult to make.
Future
Speaking of the information about the future, it’s important to remember that everything we do has a direct impact on it. Every action has its consequences of different duration in the future. So, before making a decision, it’s better to dwell upon its results in prospect.
How Can Epicflow Contribute?
Going back to project management, a necessary prerequisite of a good project decision is that the data must be stored in one place so that the PM wouldn’t have to search for different sources to find what they’re looking for. The analysis should be performed properly and thoughtfully without wasting time for searching: the number one rule is that information must be at hand.
With Epicflow, its users can manage their information to make project decisions easier, with fewer risks, and more efficiently. Our researchers and developers are focused on your comfort and performance, which is why they designed and implemented the features demonstrating your previous, current, and future progress in Pipeline. Epicflow algorithm automatically processes all data, analyzing previous state of things and output, and suggests the best way to allocate your resources and prioritize tasks.
Problem 1. Ambiguity: How Can I Find Causes of Project Failure?
If we face a problem of overload or clearly see that the project is failing to meet the deadline, it’s a result of our improper management in the past. When we have a problem, we have to resolve it by changing the project schedule and taking a lot of extra activities. It would be much more efficient if we prevent the breakdown, wouldn’t it?
Solution: Historical Data Review

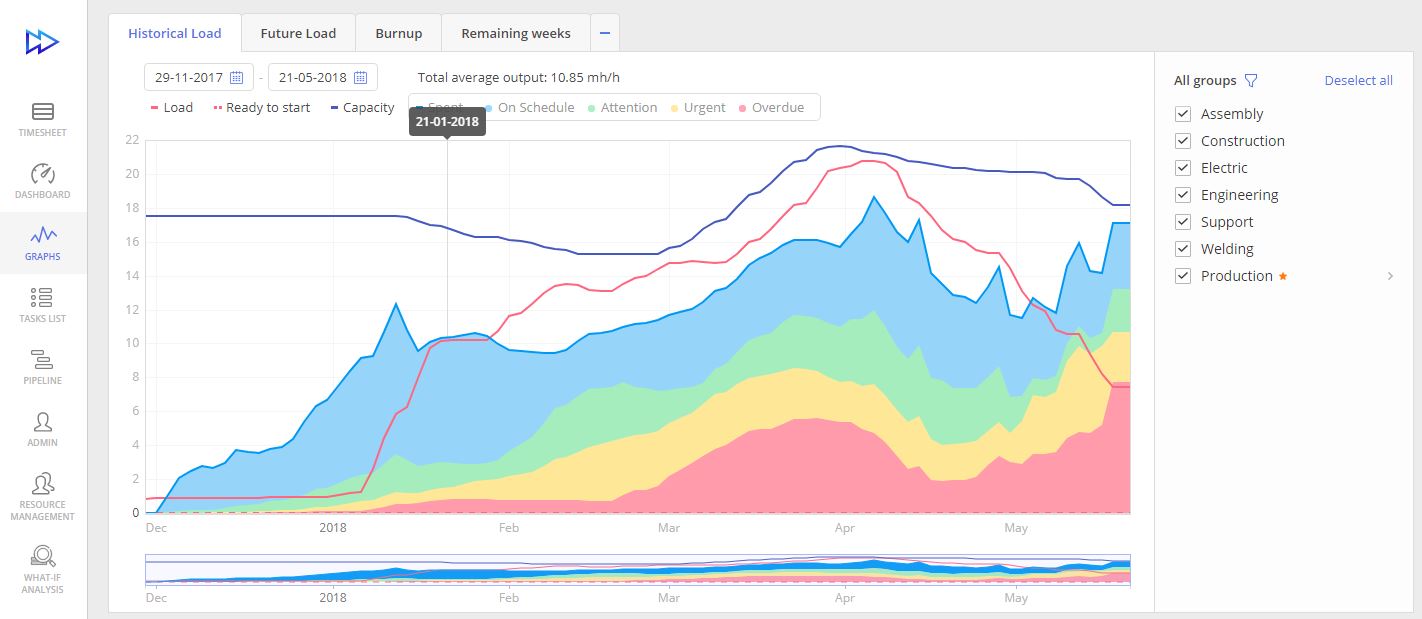
The Historical Load Graph demonstrates the development of workflow and capacity as well as the output in the past. In this graph, different colors are used to denote the state of the output: blue is for “on schedule”, green is for “attention”, yellow is for “urgent”, and red is for “overdue”. Its two axes “Date” and “Full-time Equivalent” contain historical data for all selected Resource Groups.
This graph consists of three subgraphs indicating the following items:
- Capacity demonstrates the expected output based on availability and working hours for each team member.
- Load shows the workload for the chosen teams for a particular moment.
- Output indicates the produced result.
The Historical Load Graph displays an overview of the team output in the interrelation with the capacity. In an ideal scenario, output and capacity are equal. Any differences between them mean that either your team is overloaded or underloaded. In both cases, the output is poor.
Problem 2. Multitasking: What Task Should Be Resolved First?
When working in a multi-project environment, this problem is one of the main concerns of any project manager. Manual prioritization takes time and might be inaccurate. Wrong prioritization is dangerous for projects and can result in a collapse.
Solution: Accurate Automatic Real-Time Prioritization

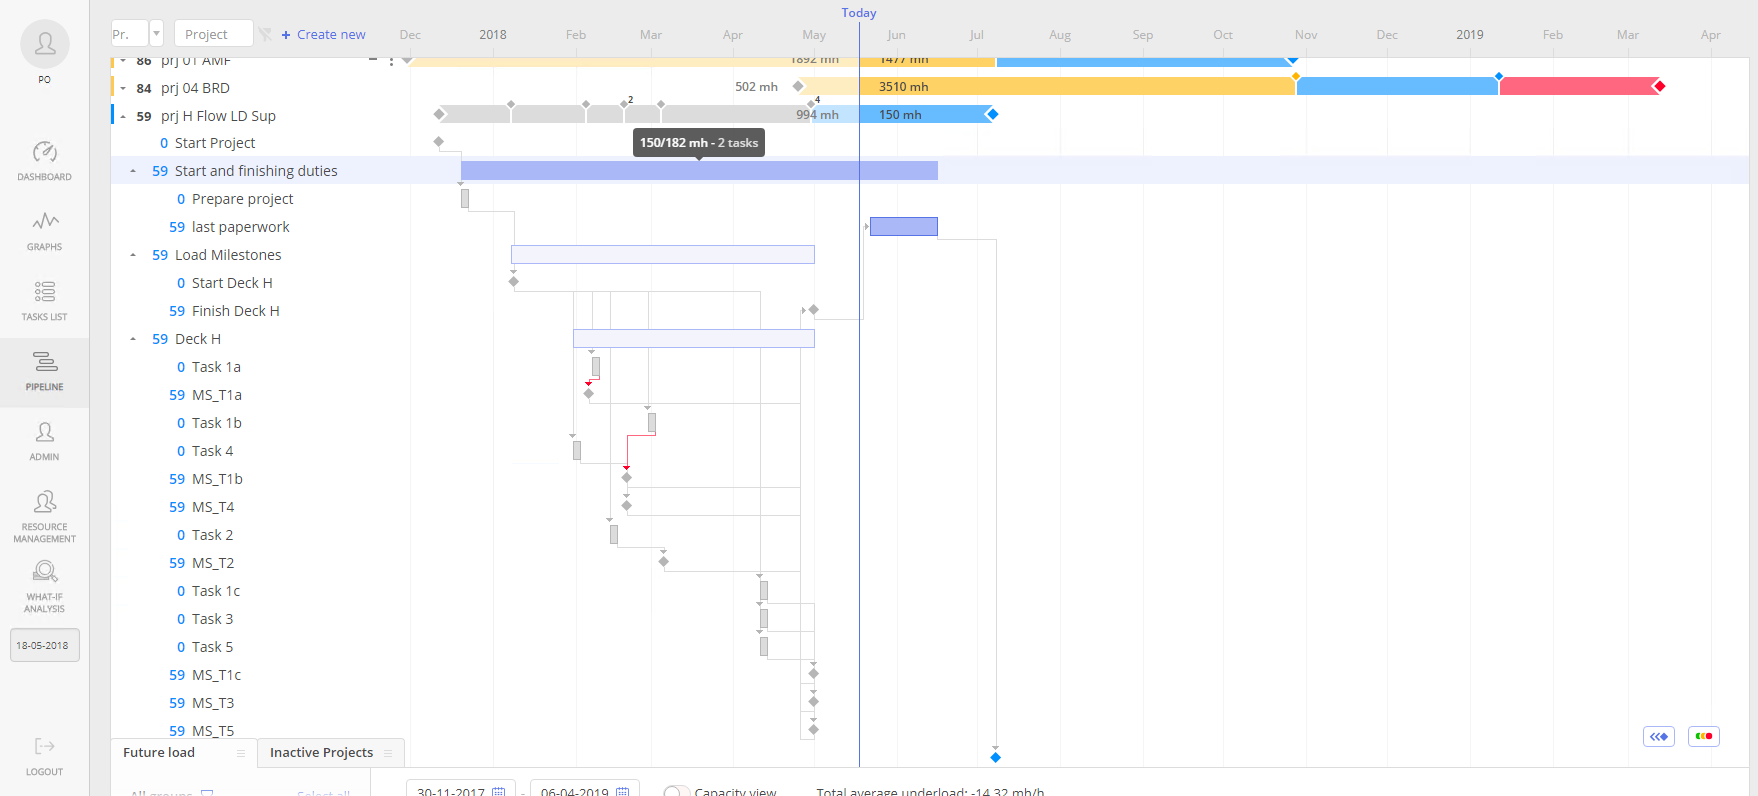
For you to be aware of the current workflow, Epicflow shows it in Pipeline. You can see more detailed information in a Gantt chart, where real-time data with milestones, workload, sprints, and releases are presented. The process becomes easier if current information is displayed graphically, where all interdependent and parallel processes are shown. Prioritization is one of the most significant functions of Epicflow. Here you can see the same colors with the same meaning as described above for Historical Load Graph. In Pipeline, you can also find Top Critical Path. It’s the longest chain of dependent tasks having the highest priority. Here you can change milestone dates and navigate between different milestones, and review current tasks from the chain.
Problem 3. Unpredictability: How Can I Be Sure I Have Enough Resources for Initiating a New Project?
Again, when managing multiple projects, you will definitely find yourself in a situation when there’ll be another project to add to the current ones, and it’s almost impossible to foresee the consequences. You can’t be sure your team will manage to deal with all tasks successfully.
Solution: Proper Planning

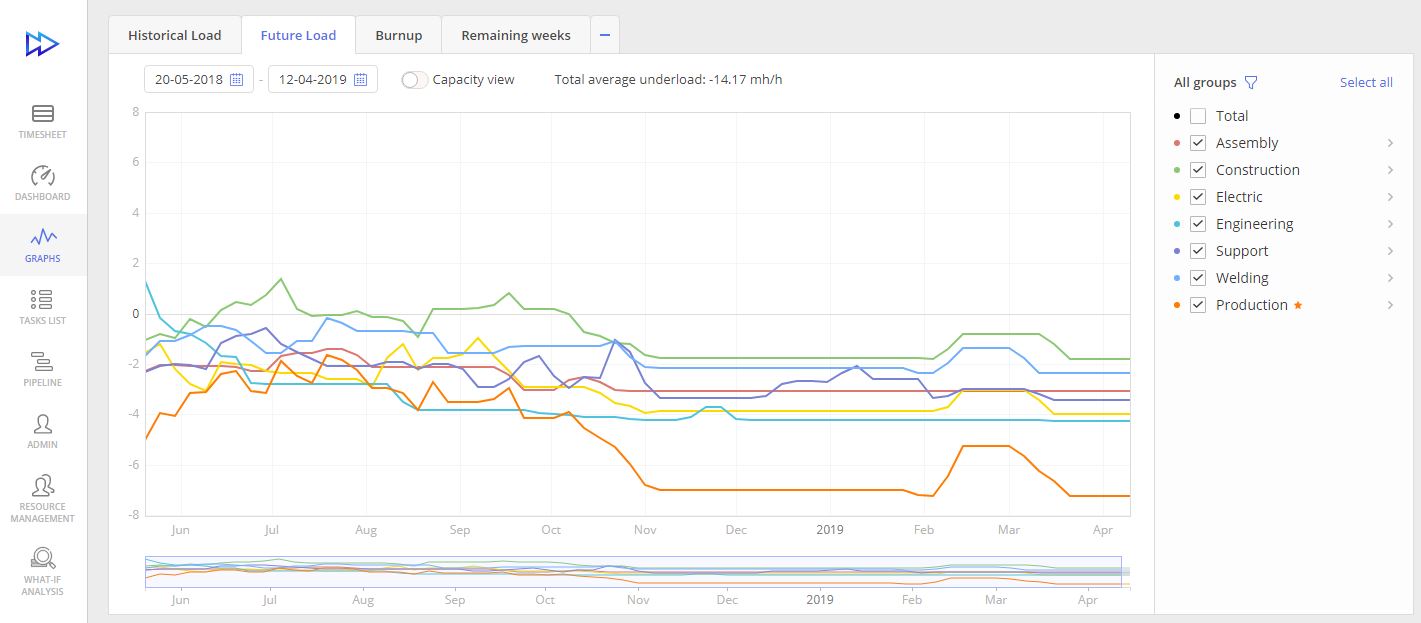
The Future Load Graph is designed to give an idea about the resources’ workload in the future based on the current data in Pipeline. It shows if an employee is over- or underloaded in the future. The overload will potentially lead to a bottleneck and a smooth workflow will be blocked. It’s a great assistant in resource management as it helps to foresee the results of adding multiple projects to Pipeline.
Here you can also apply the What-if Analysis function that will figure out the reasonableness of your decisions. In case of a probable failure, it will suggest alternative variants of allocating resources and display the consequences of any changes in your project schedule.
The Future Load Graph also provides the Capacity view to display the biggest output your team can produce in the future for a certain period of time. Thus, you will see your team’s real capacity against their workload and output.
So, make the main decision in your PM practice – choose a software solution that would make your decision-making journey smooth and fruitful.


