Explore Your Resources’ Workload at Different Levels in the Task List
Personal Task List
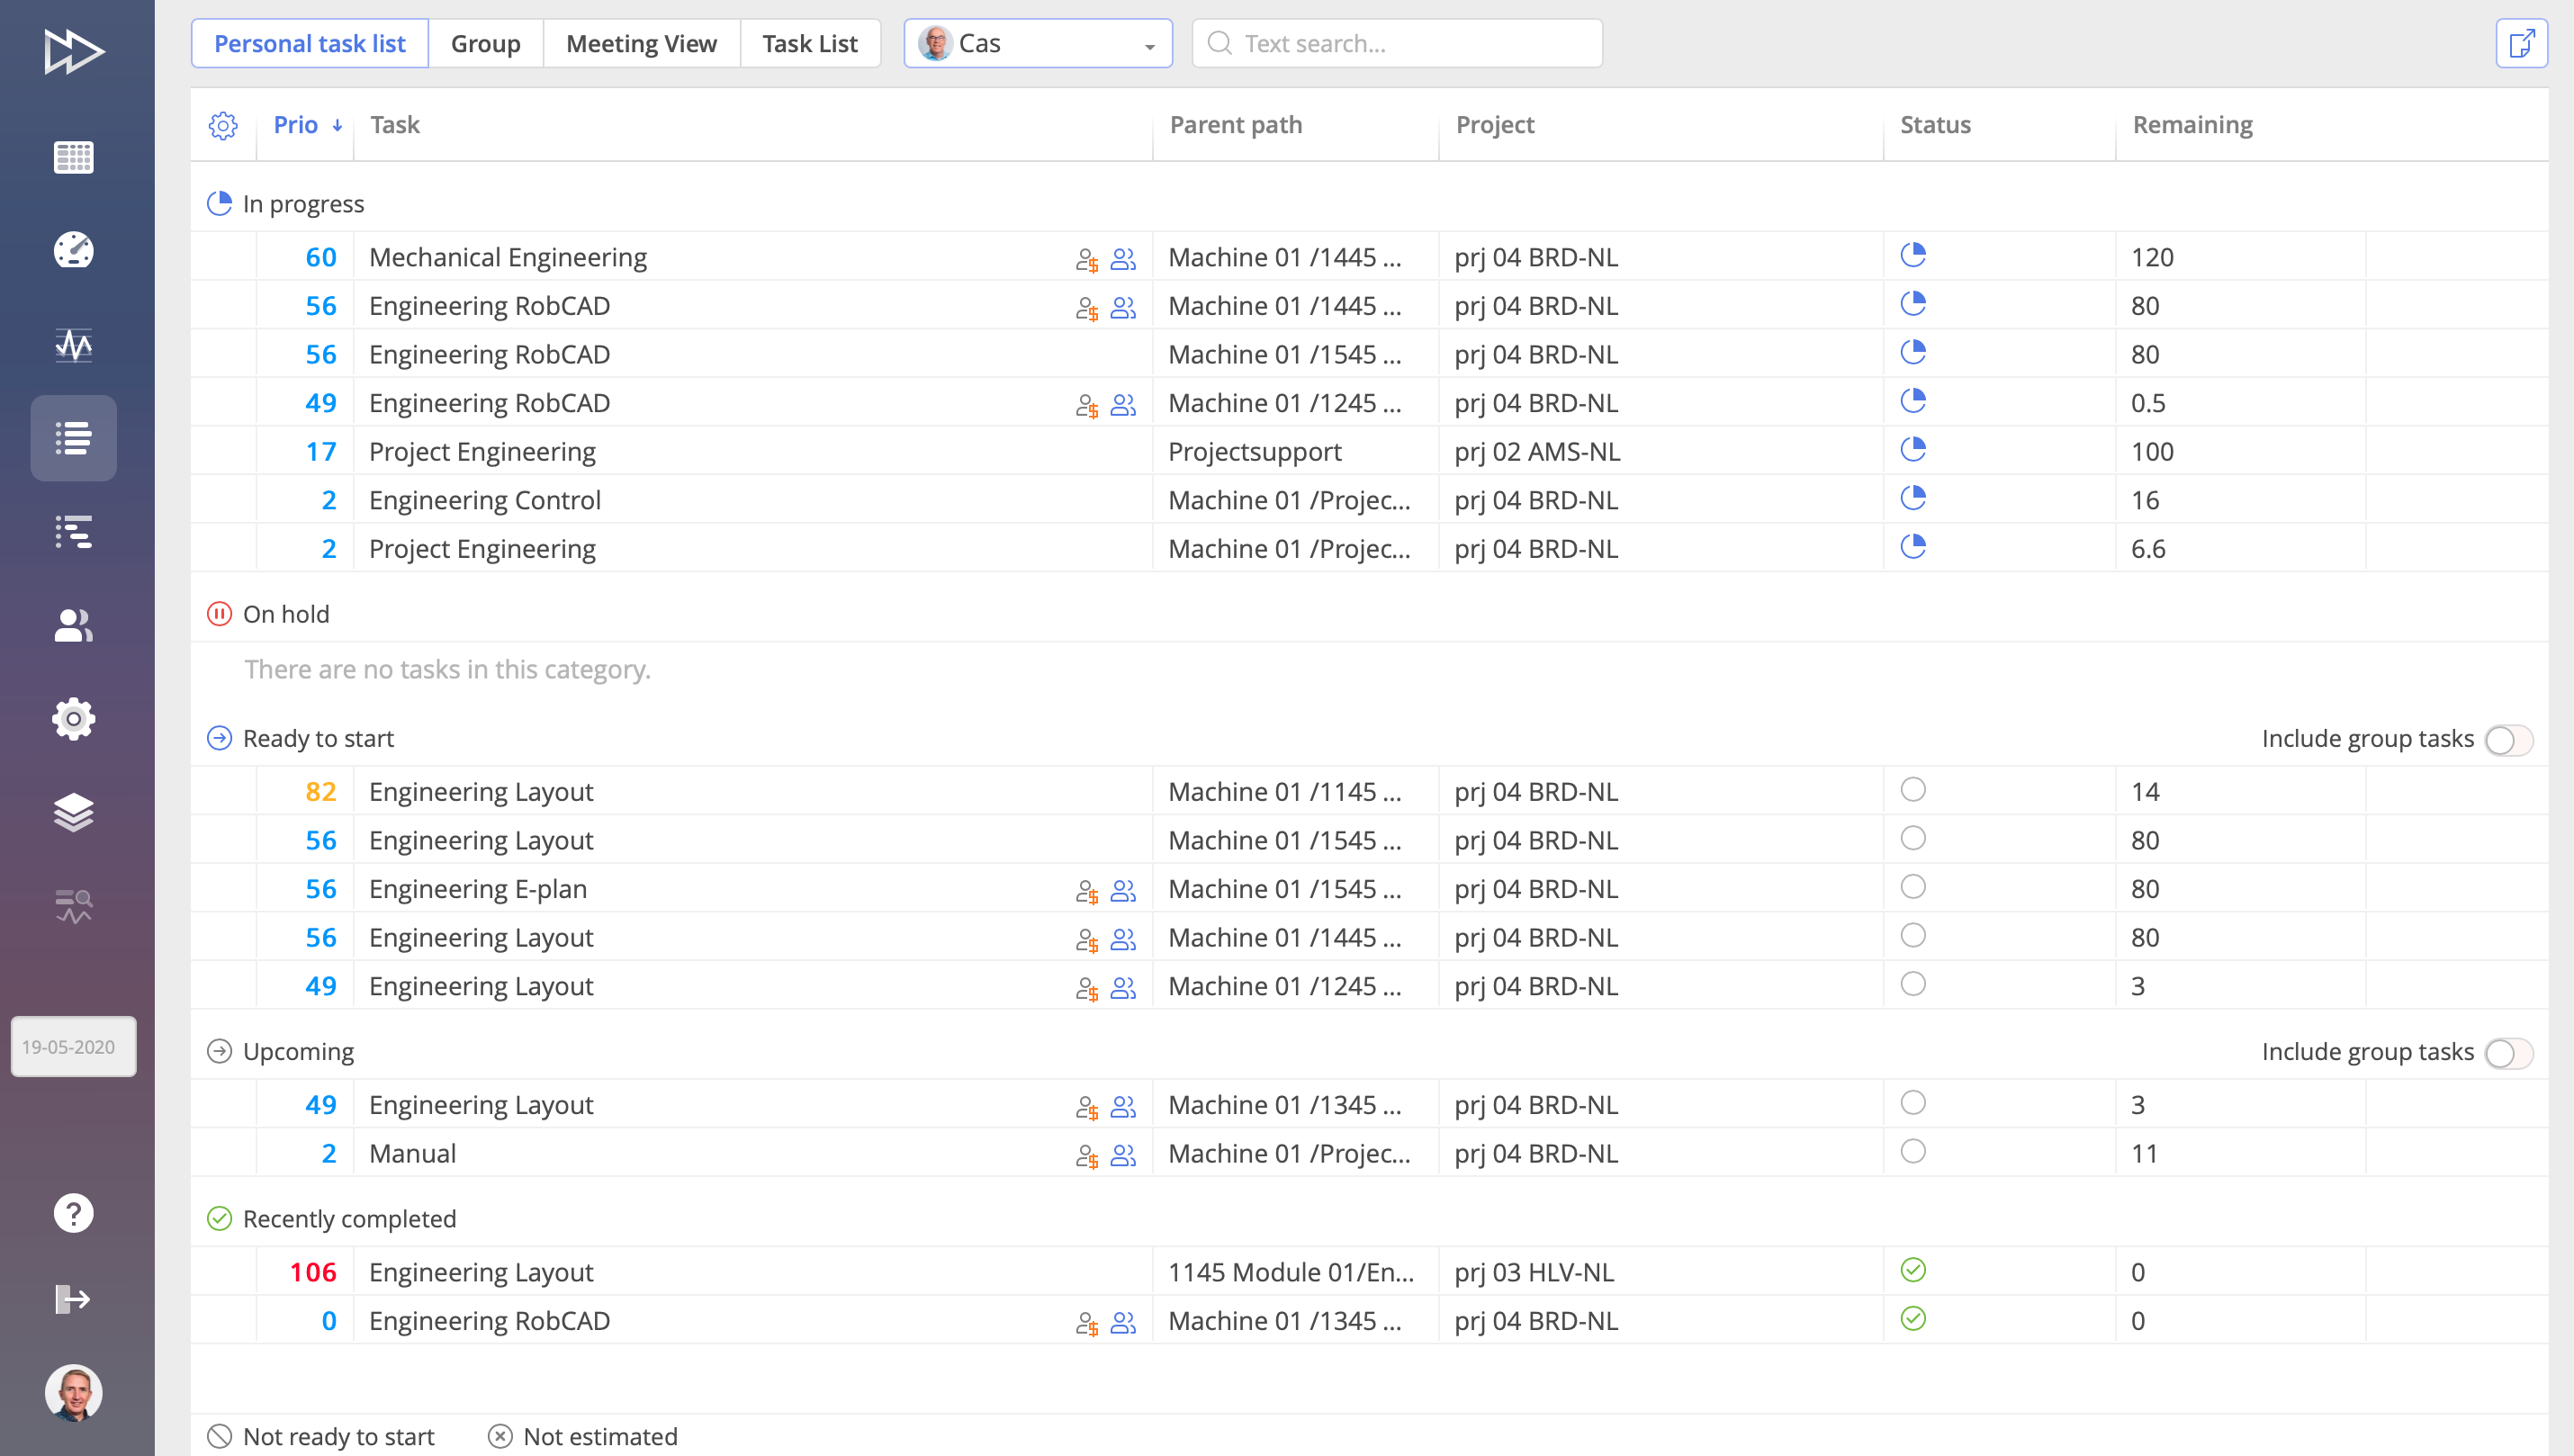 Here single users can review their own and other team members’ tasks divided into categories.
Meeting View
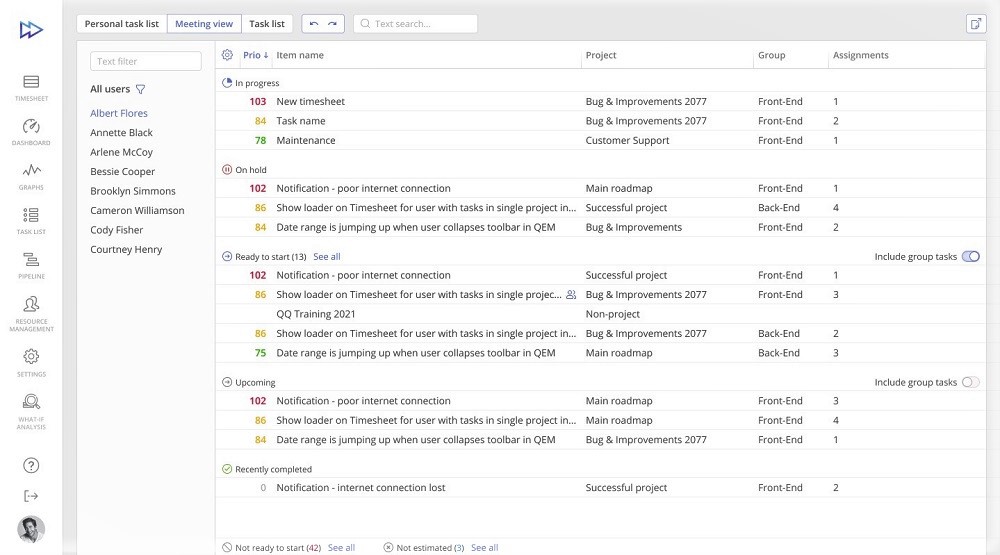 A convenient tool for task analysis during meetings and standups with a customized list of users.
Task List
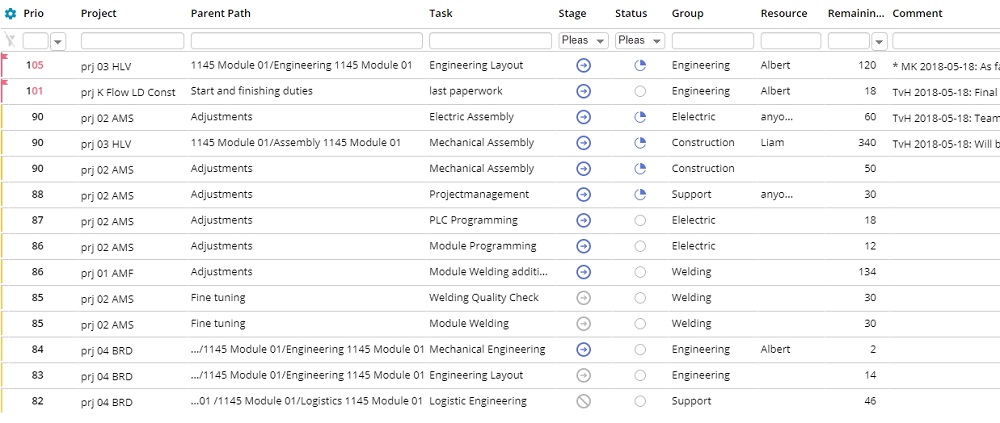 A general list of the project team’s tasks ordered by priority. Upon entering Task List page, users find themselves in this tab by default.
Task List’s Group Tab Modes
Category View
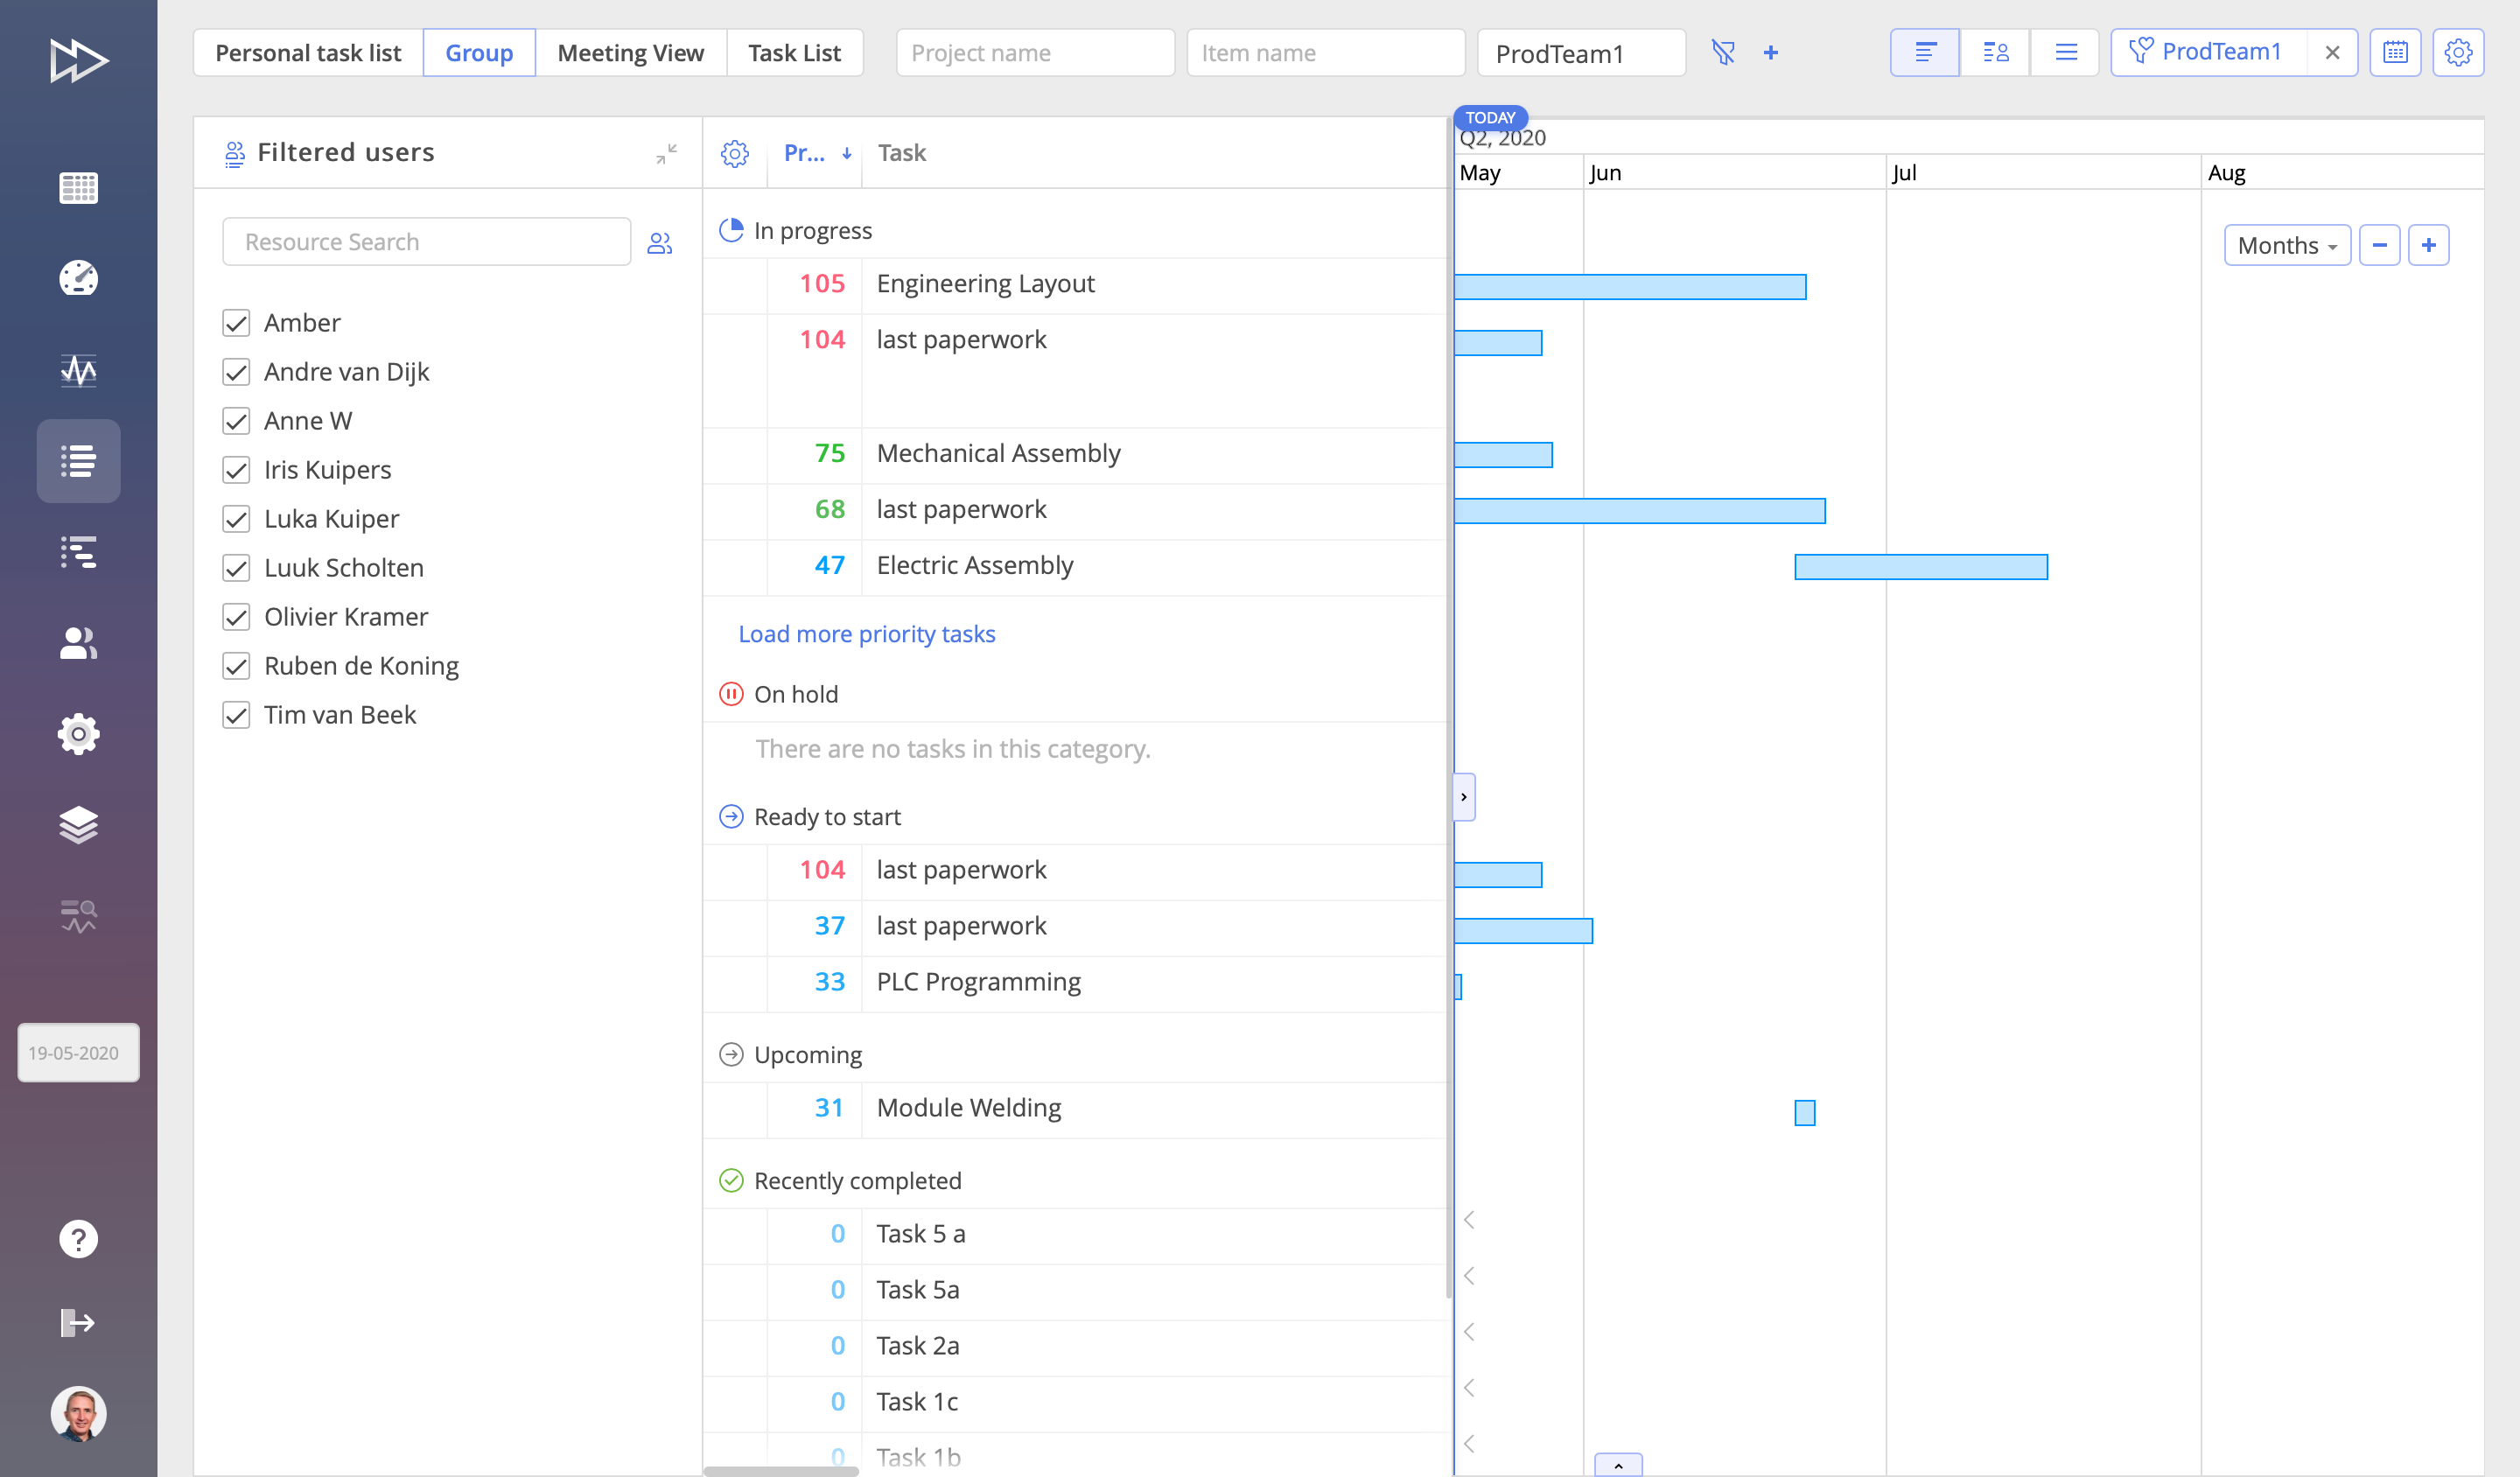
- This category view is similar to the Personal Task List tab with the tasks divided by categories according to their statuses (not ready to start, upcoming, ready to start, on hold, in progress).
- In this view, only the top 5 tasks with the highest priority are shown by default, but you can load more tasks.
User View
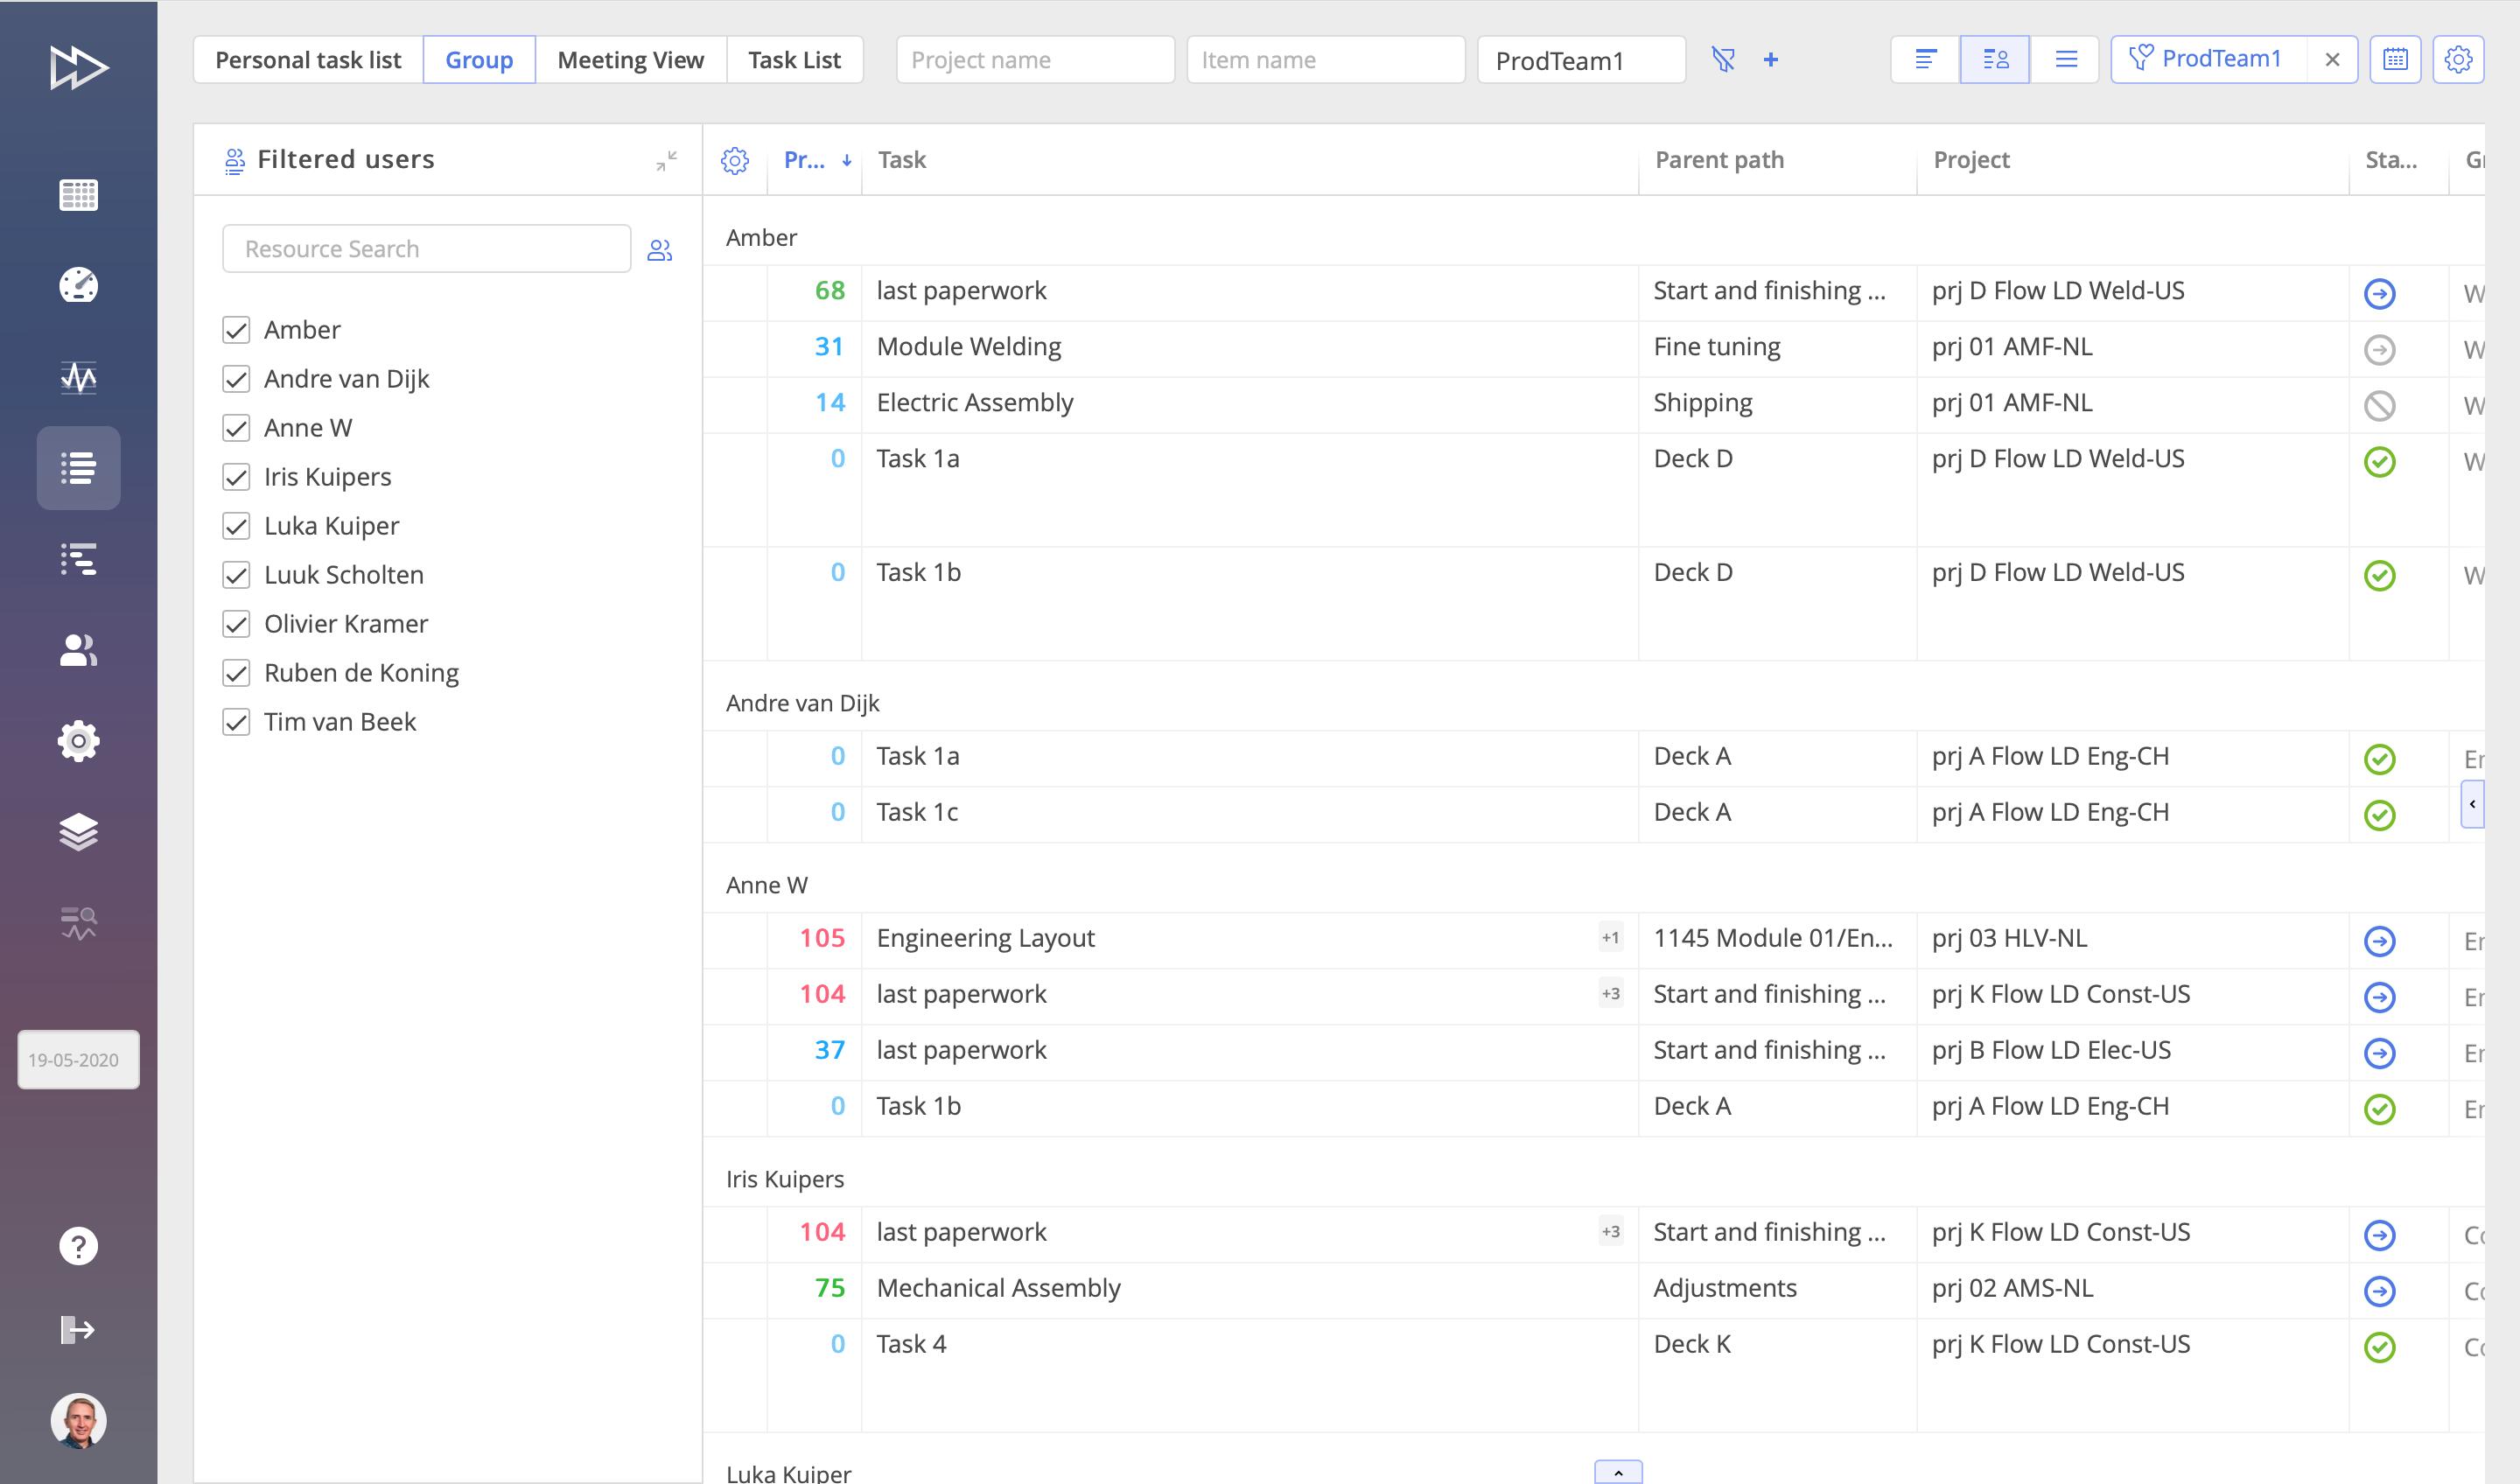
- In this view, you can check all tasks assigned to a resource (or resources) that you selected.
- The tasks are ordered by priority, and only 5 highest-priority tasks are shown by default. The list can be expanded if necessary.
Plain View
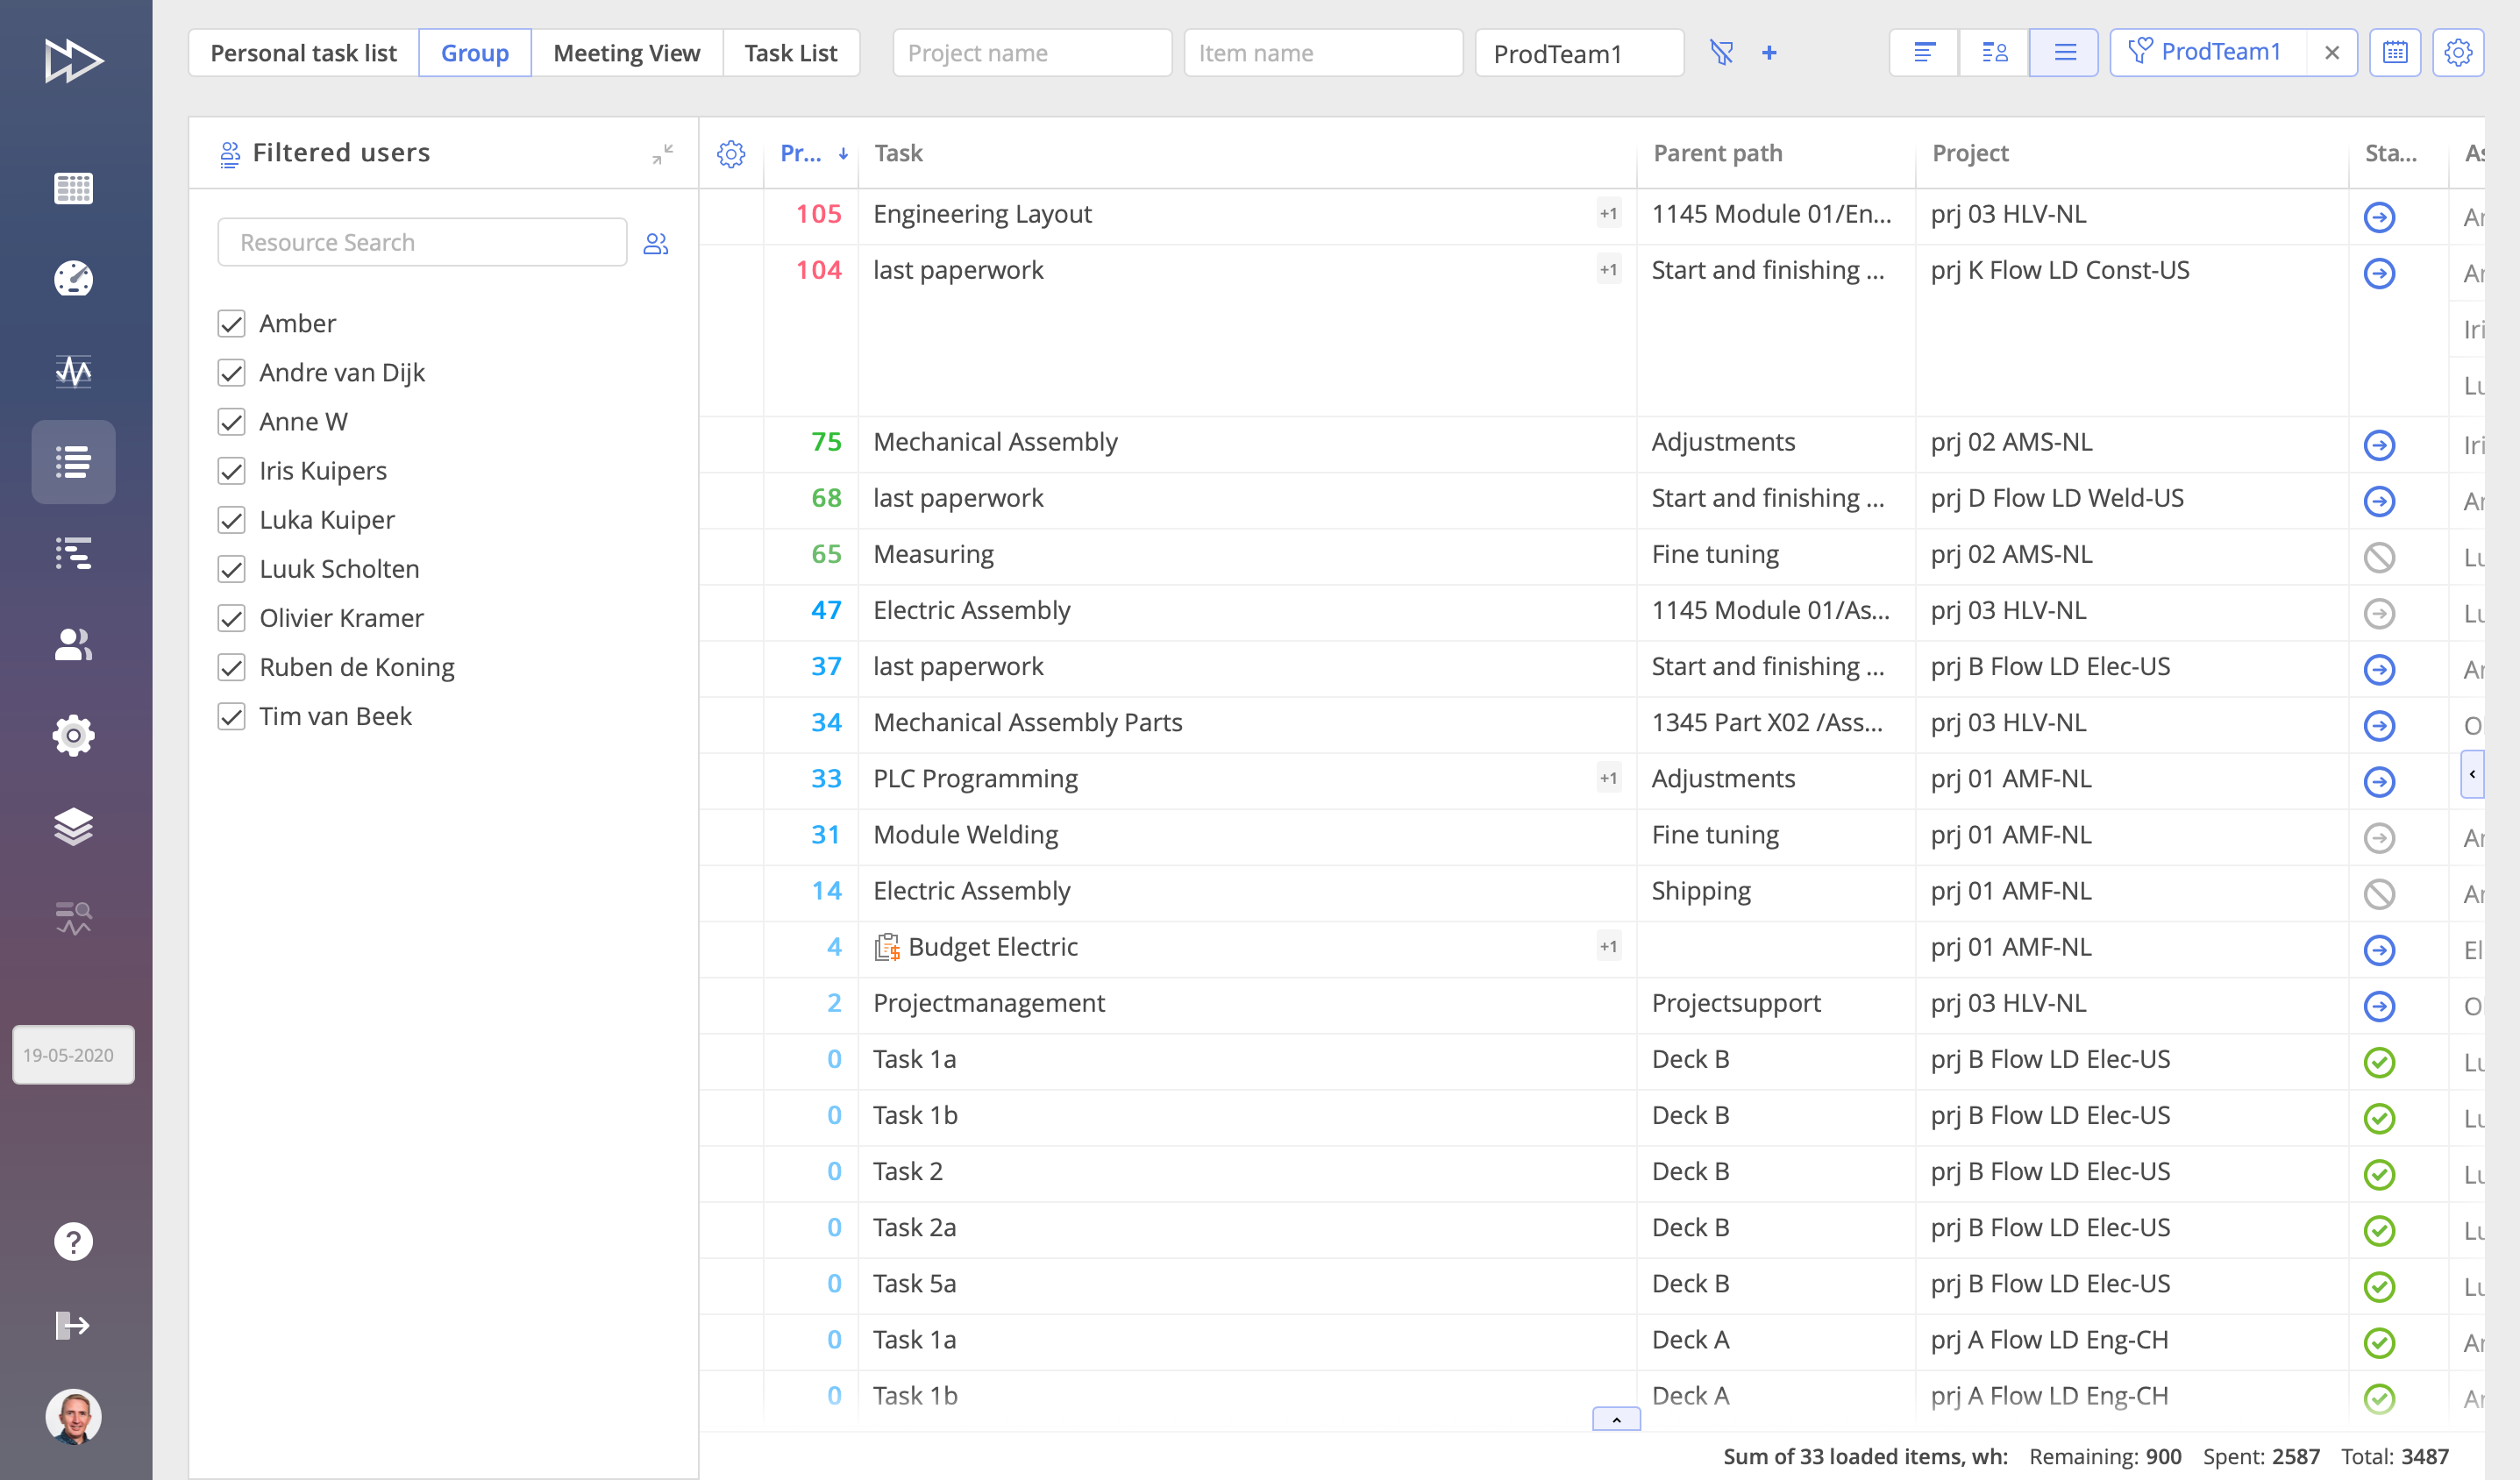
- You can select a resource group of individual resources to analyze their task-related data.
- Upon the selection, you get an overview of all tasks that are planned for the selected resources.
- In this view, tasks are ordered according to the priority.
You can use filters for easier search and analysis. Tip: Apply tags to define a team that works on the same project but consists of the users from different groups. For instance, you can create a tag “Production team” to gather users from Construction, Assembly, Welding, and other groups and then filter users by this tag to analyze their workload. Then you can enable a user view to show the load of every user in this team.
Exploring Extra Information: Task Execution Timelines and Resource Load
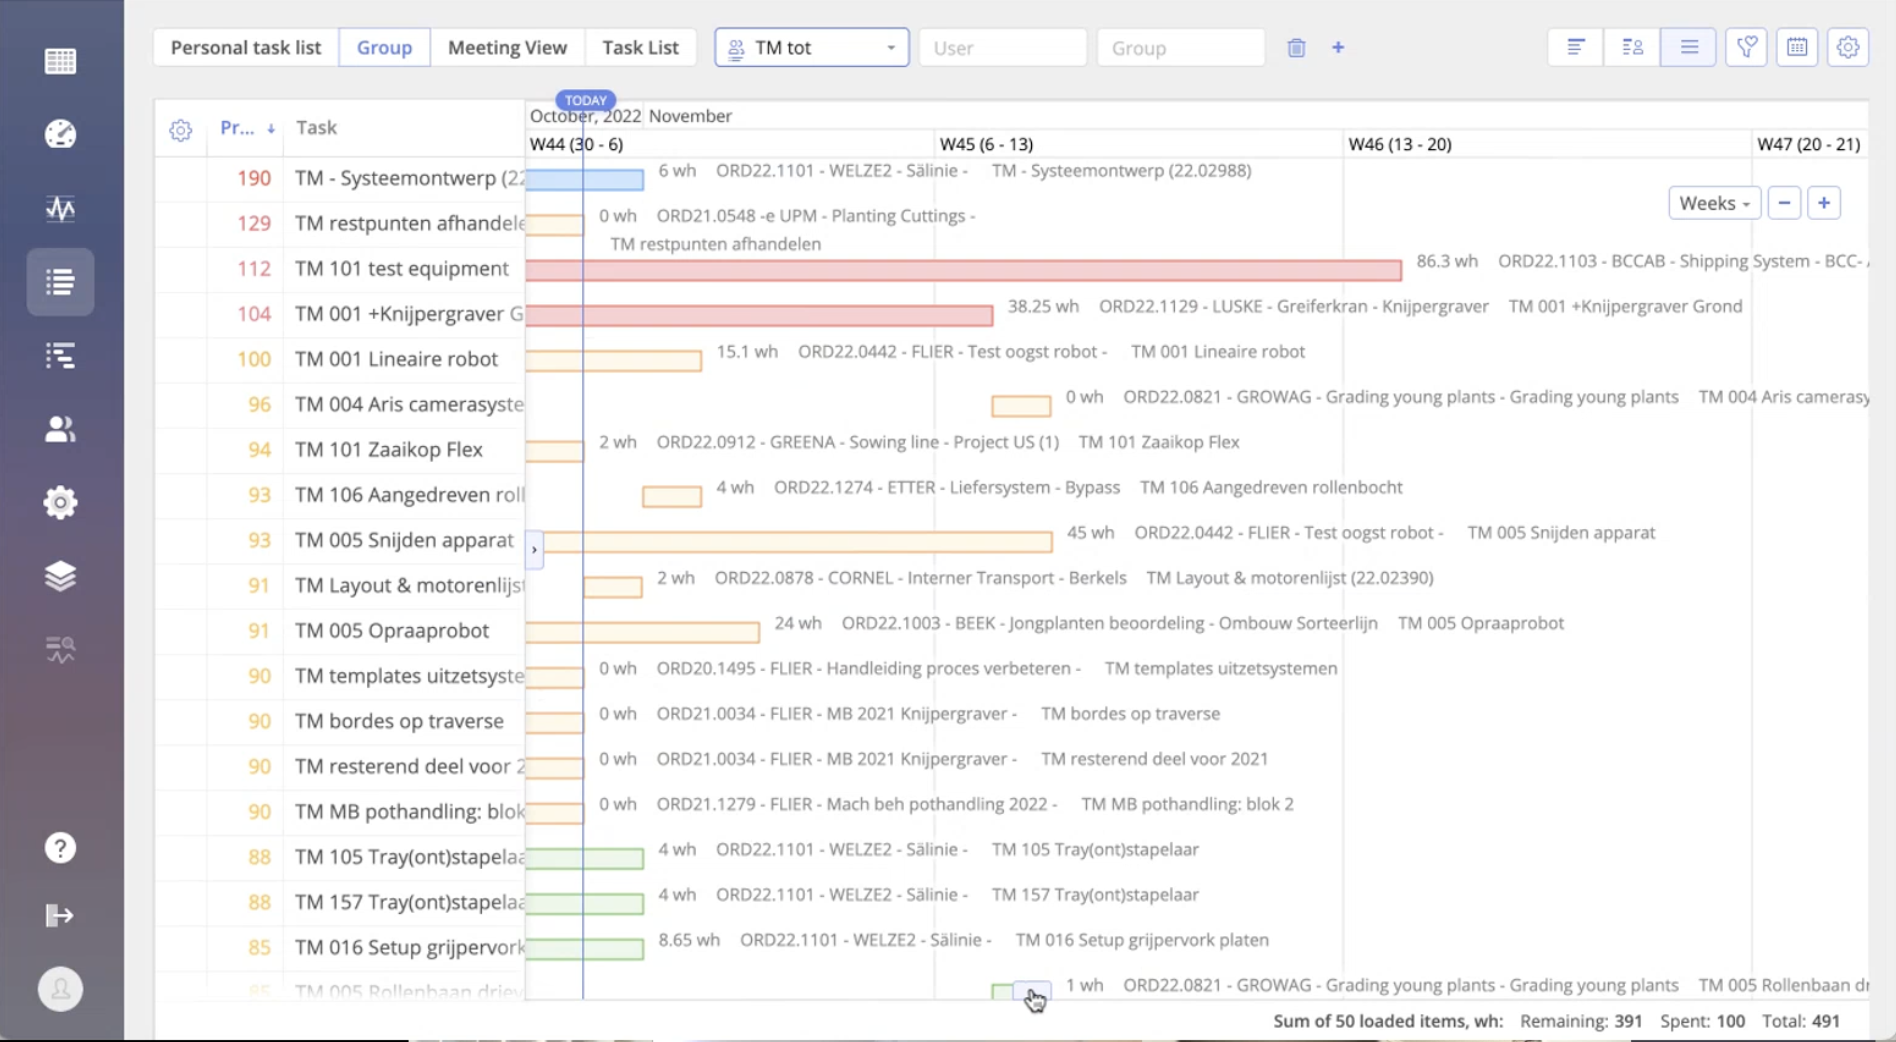
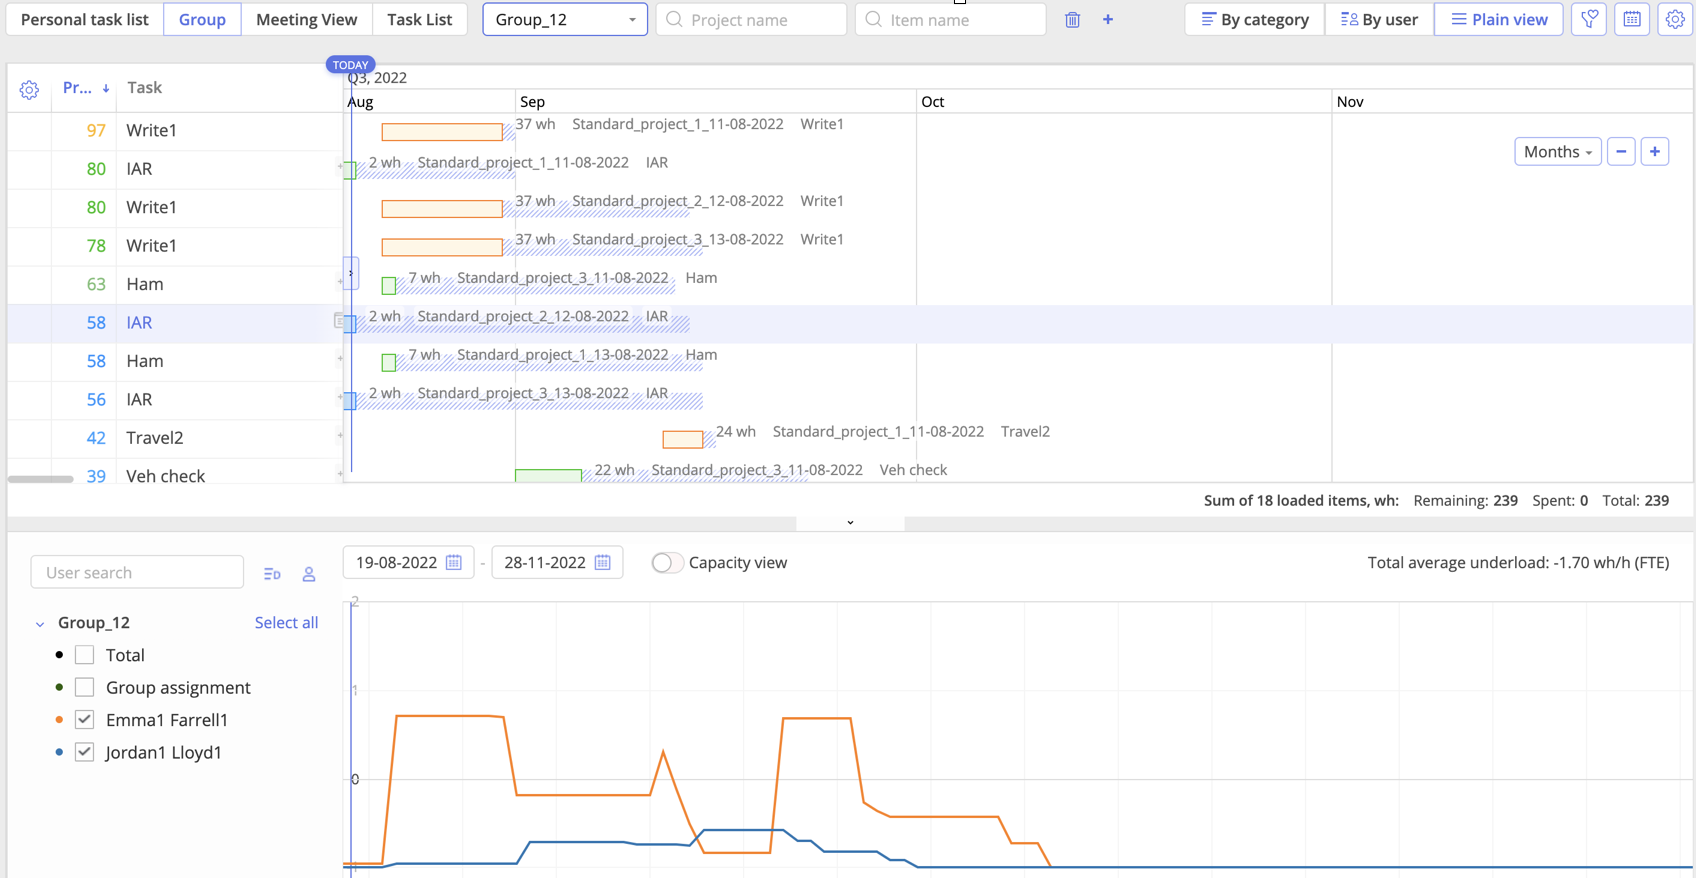
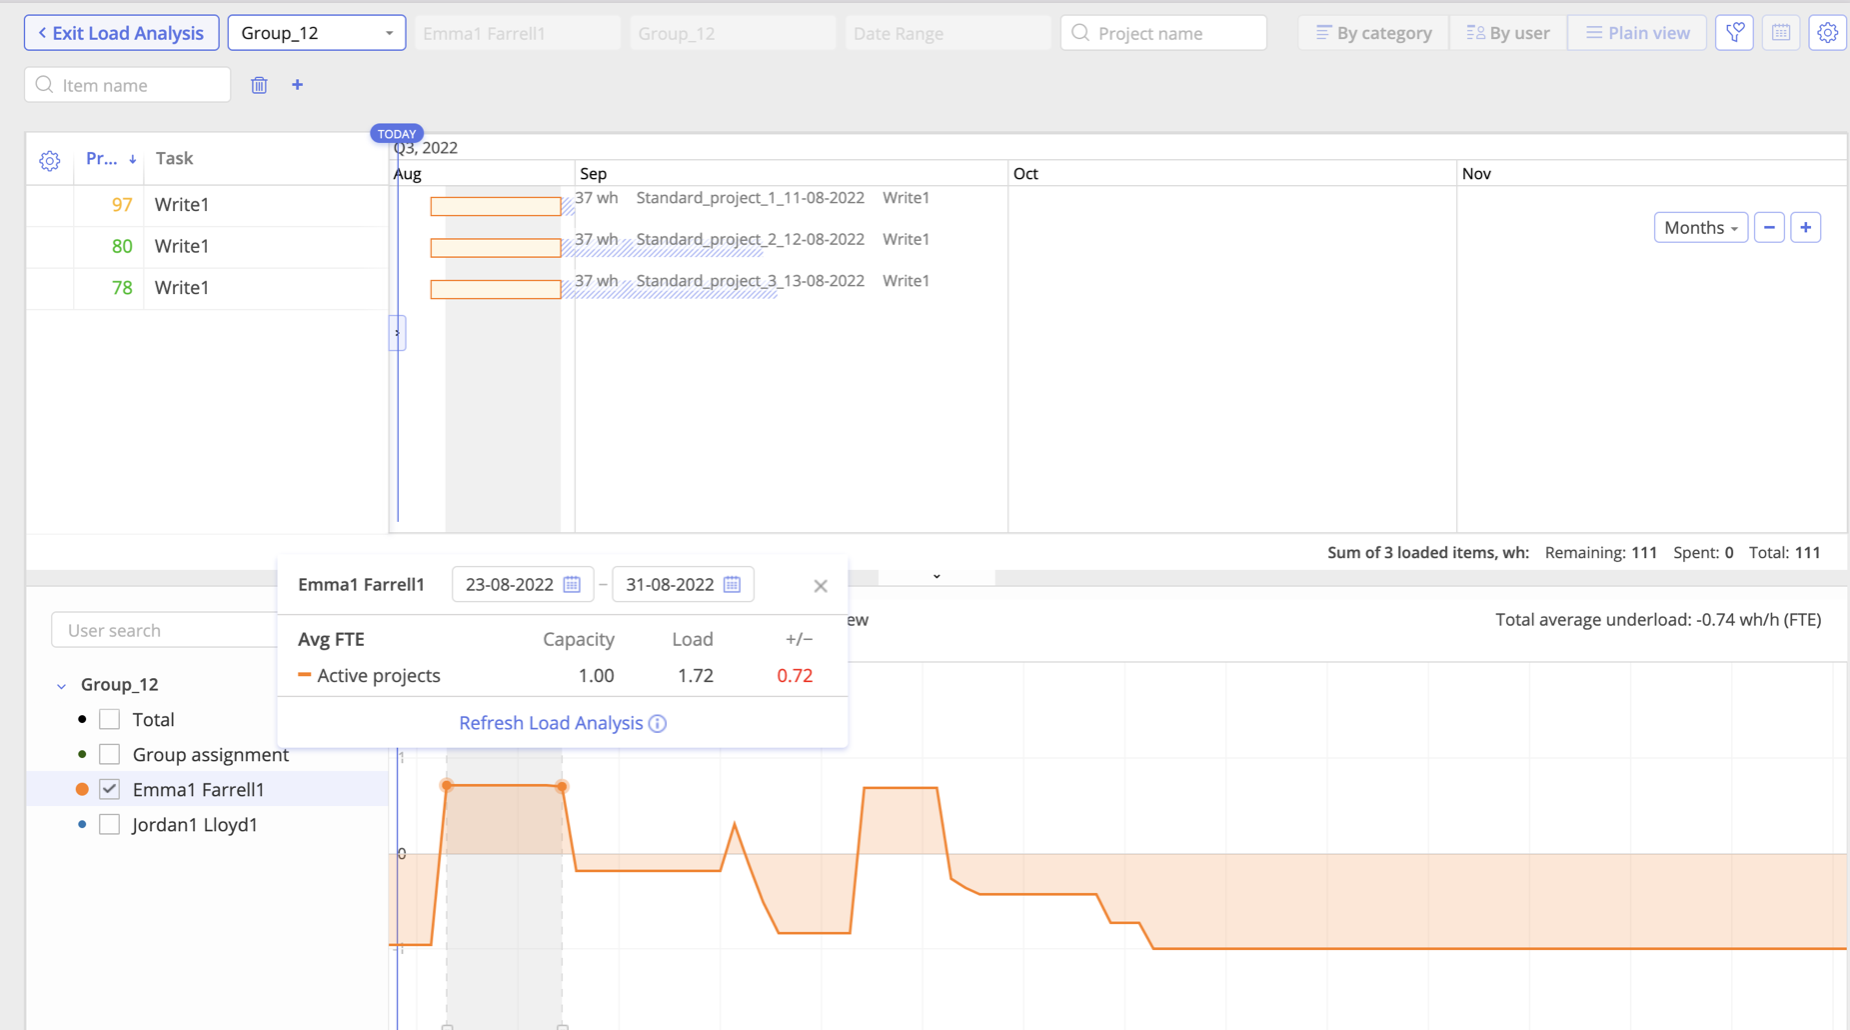
In any mode of the Group tab, you can see additional information about the period of task accomplishment and the workload the tasks put on resources. Take a look at them in a slider below (use the dots below to switch the slider and see all views of the Group tab).
Task Feasibility at Project Portfolio and Resource Levels: Time vs Capacity
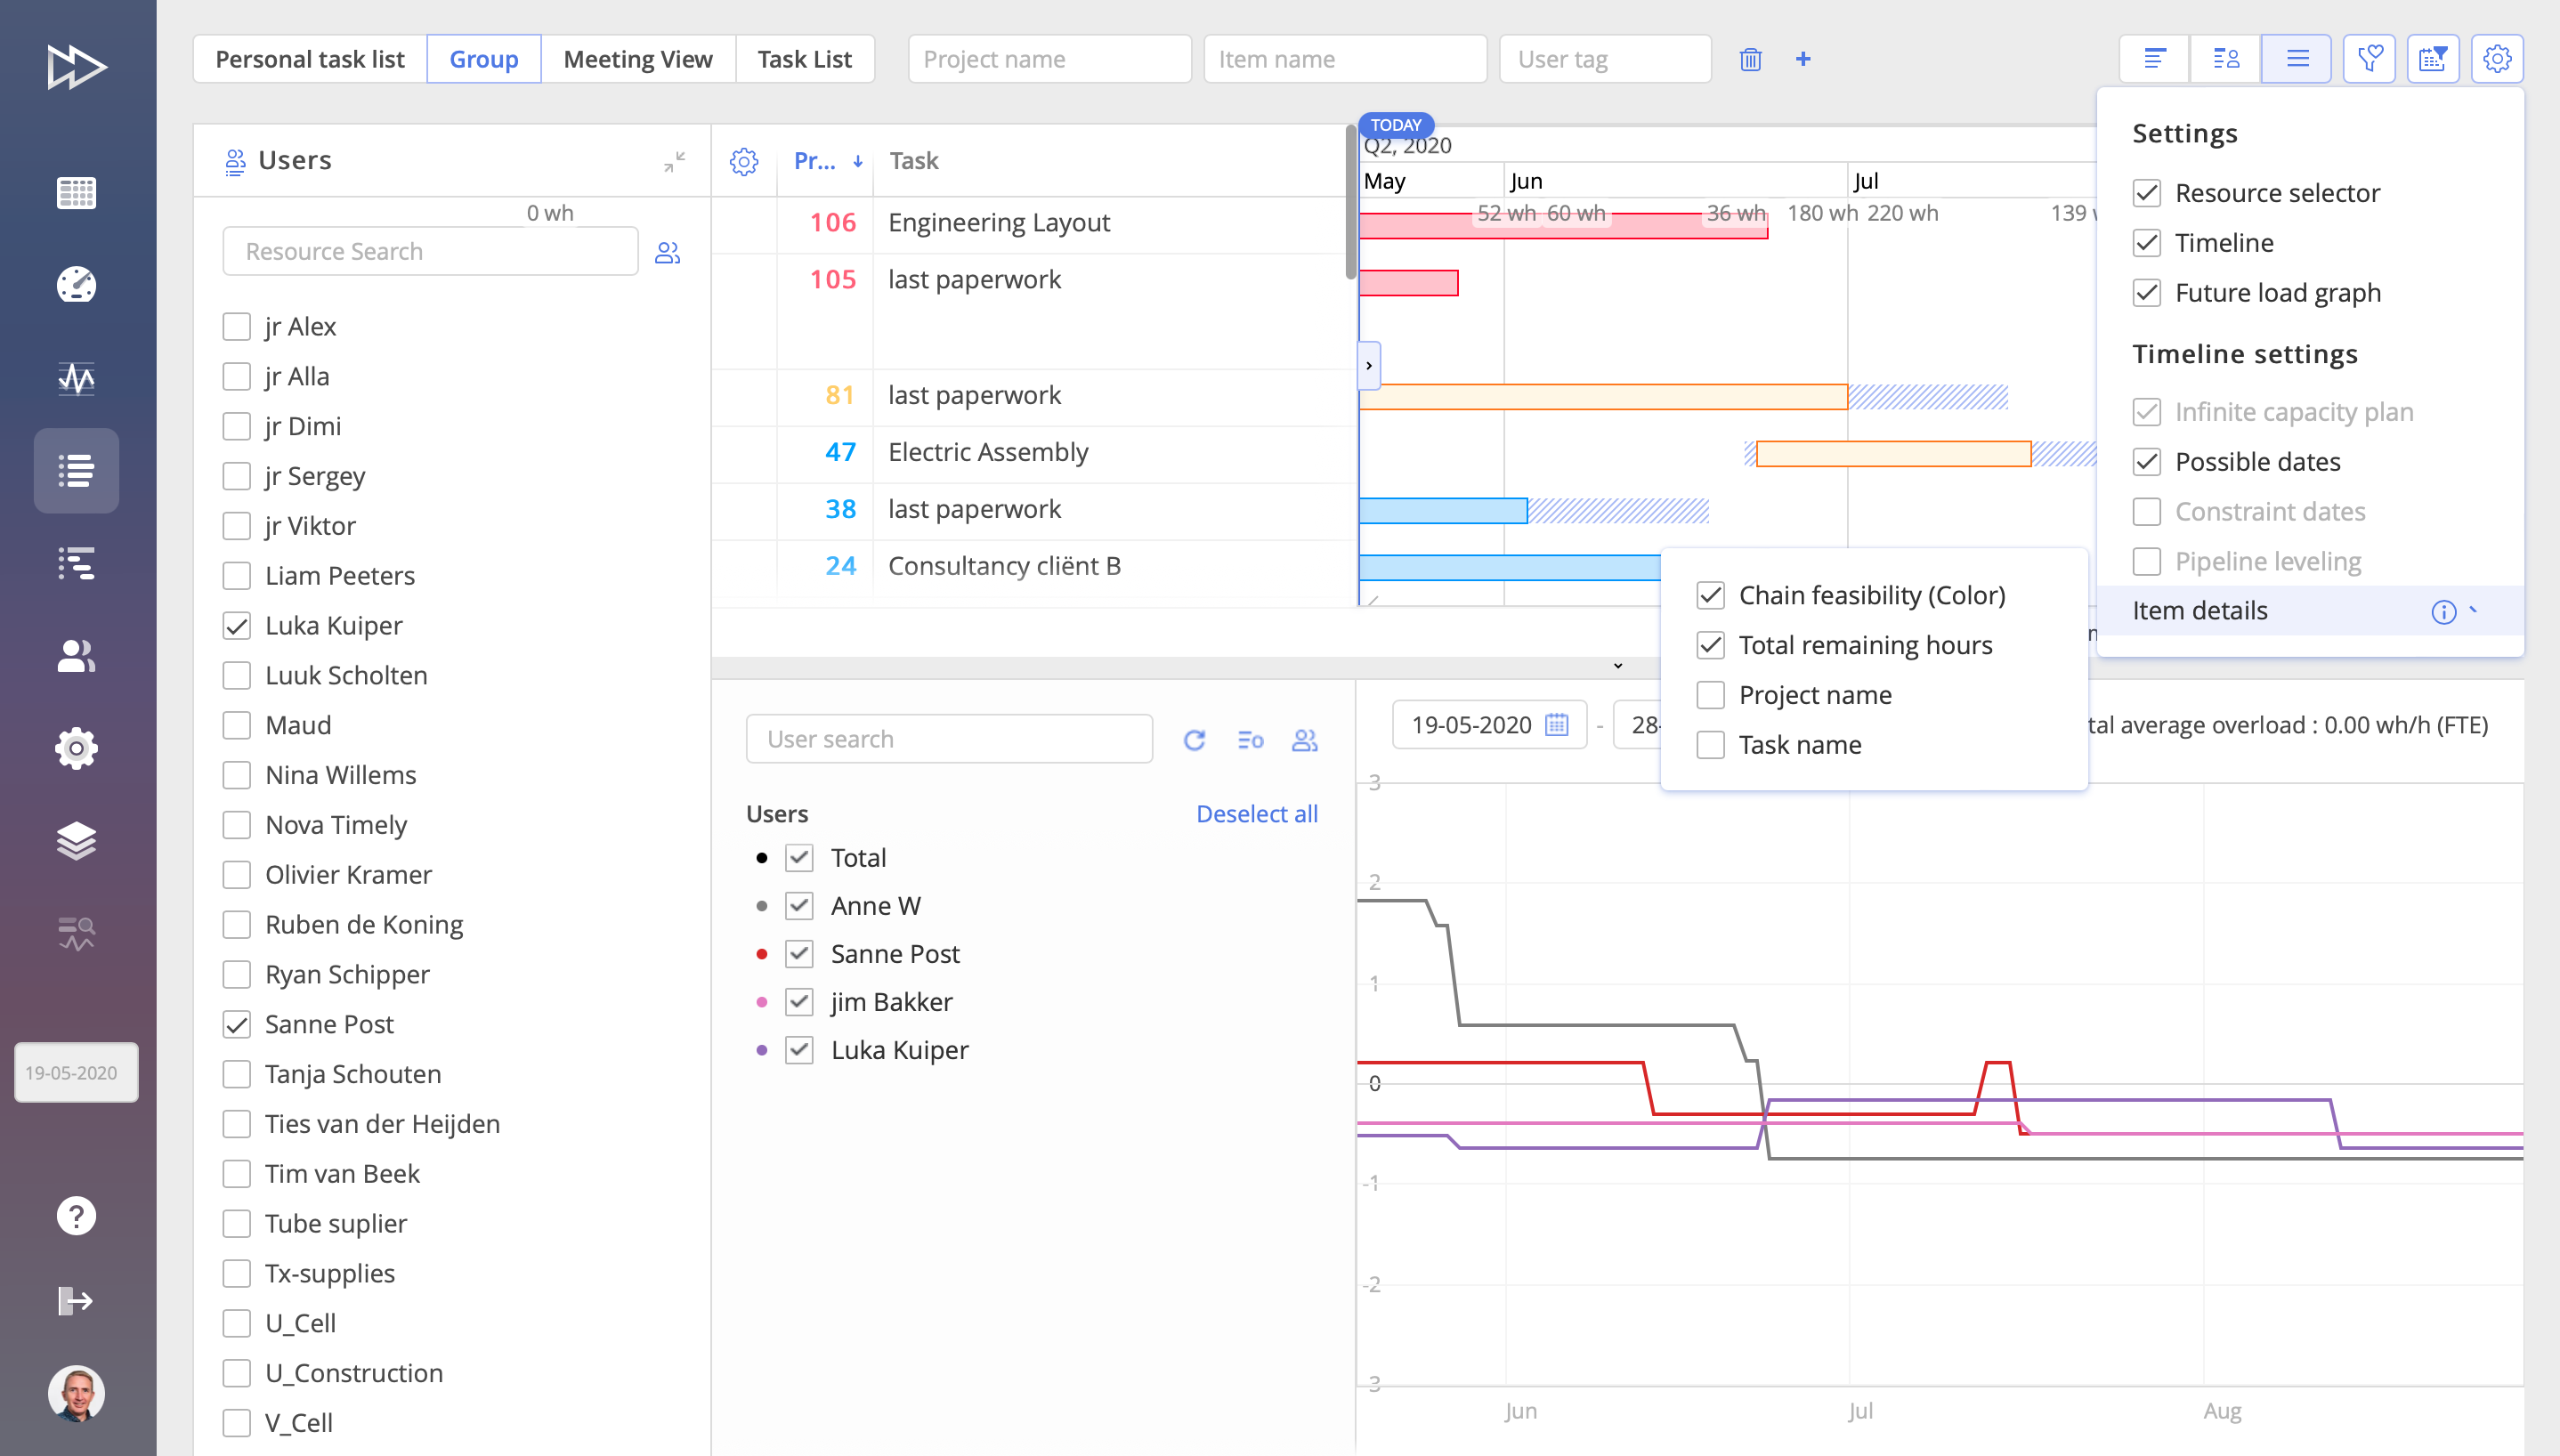
As you can see in the upper part of the picture, the bars showing tasks’ timelines are marked with the colors similar to the ones in the Pipeline (red and yellow for critical tasks, blue and green for non-critical assignments). So this part denotes the general situation across the portfolio of projects and answers the question “Do I have enough time to complete the assigned tasks?” Unlike other PM and RM tools, Epicflow shows the task feasibility from the portfolio point of view, not just the project.
In the lower part of the picture, you can see the Future load graph, which shows the data at the resource level. In simple words, it gives an answer to the question “Do I have enough capacity to complete the assigned tasks?”
Example: Let’s say a resource has three tasks 20 hours each. This user can easily do them one by one, so they’re colored green. But together they make 60 hours, which overwhelms the resource, because his or her weekly capacity is 40 hours. So, in terms of one project, the workload is suitable, but in terms of the portfolio level, it’s not. This is why one bar is green on the graph and others are red.
Watch this video to see Group Tab feature in action:
Conclusion
With the new feature of Epicflow, Group Tab in a Task List, you can have a comprehensive view of your resource groups’ tasks including all task- and project-related details as well as make load and bottleneck analysis.
To learn more about Epicflow features for efficient multi-project resource management, contact our team at epicflow@epicflow.com or schedule a call with our expert at your convenience.
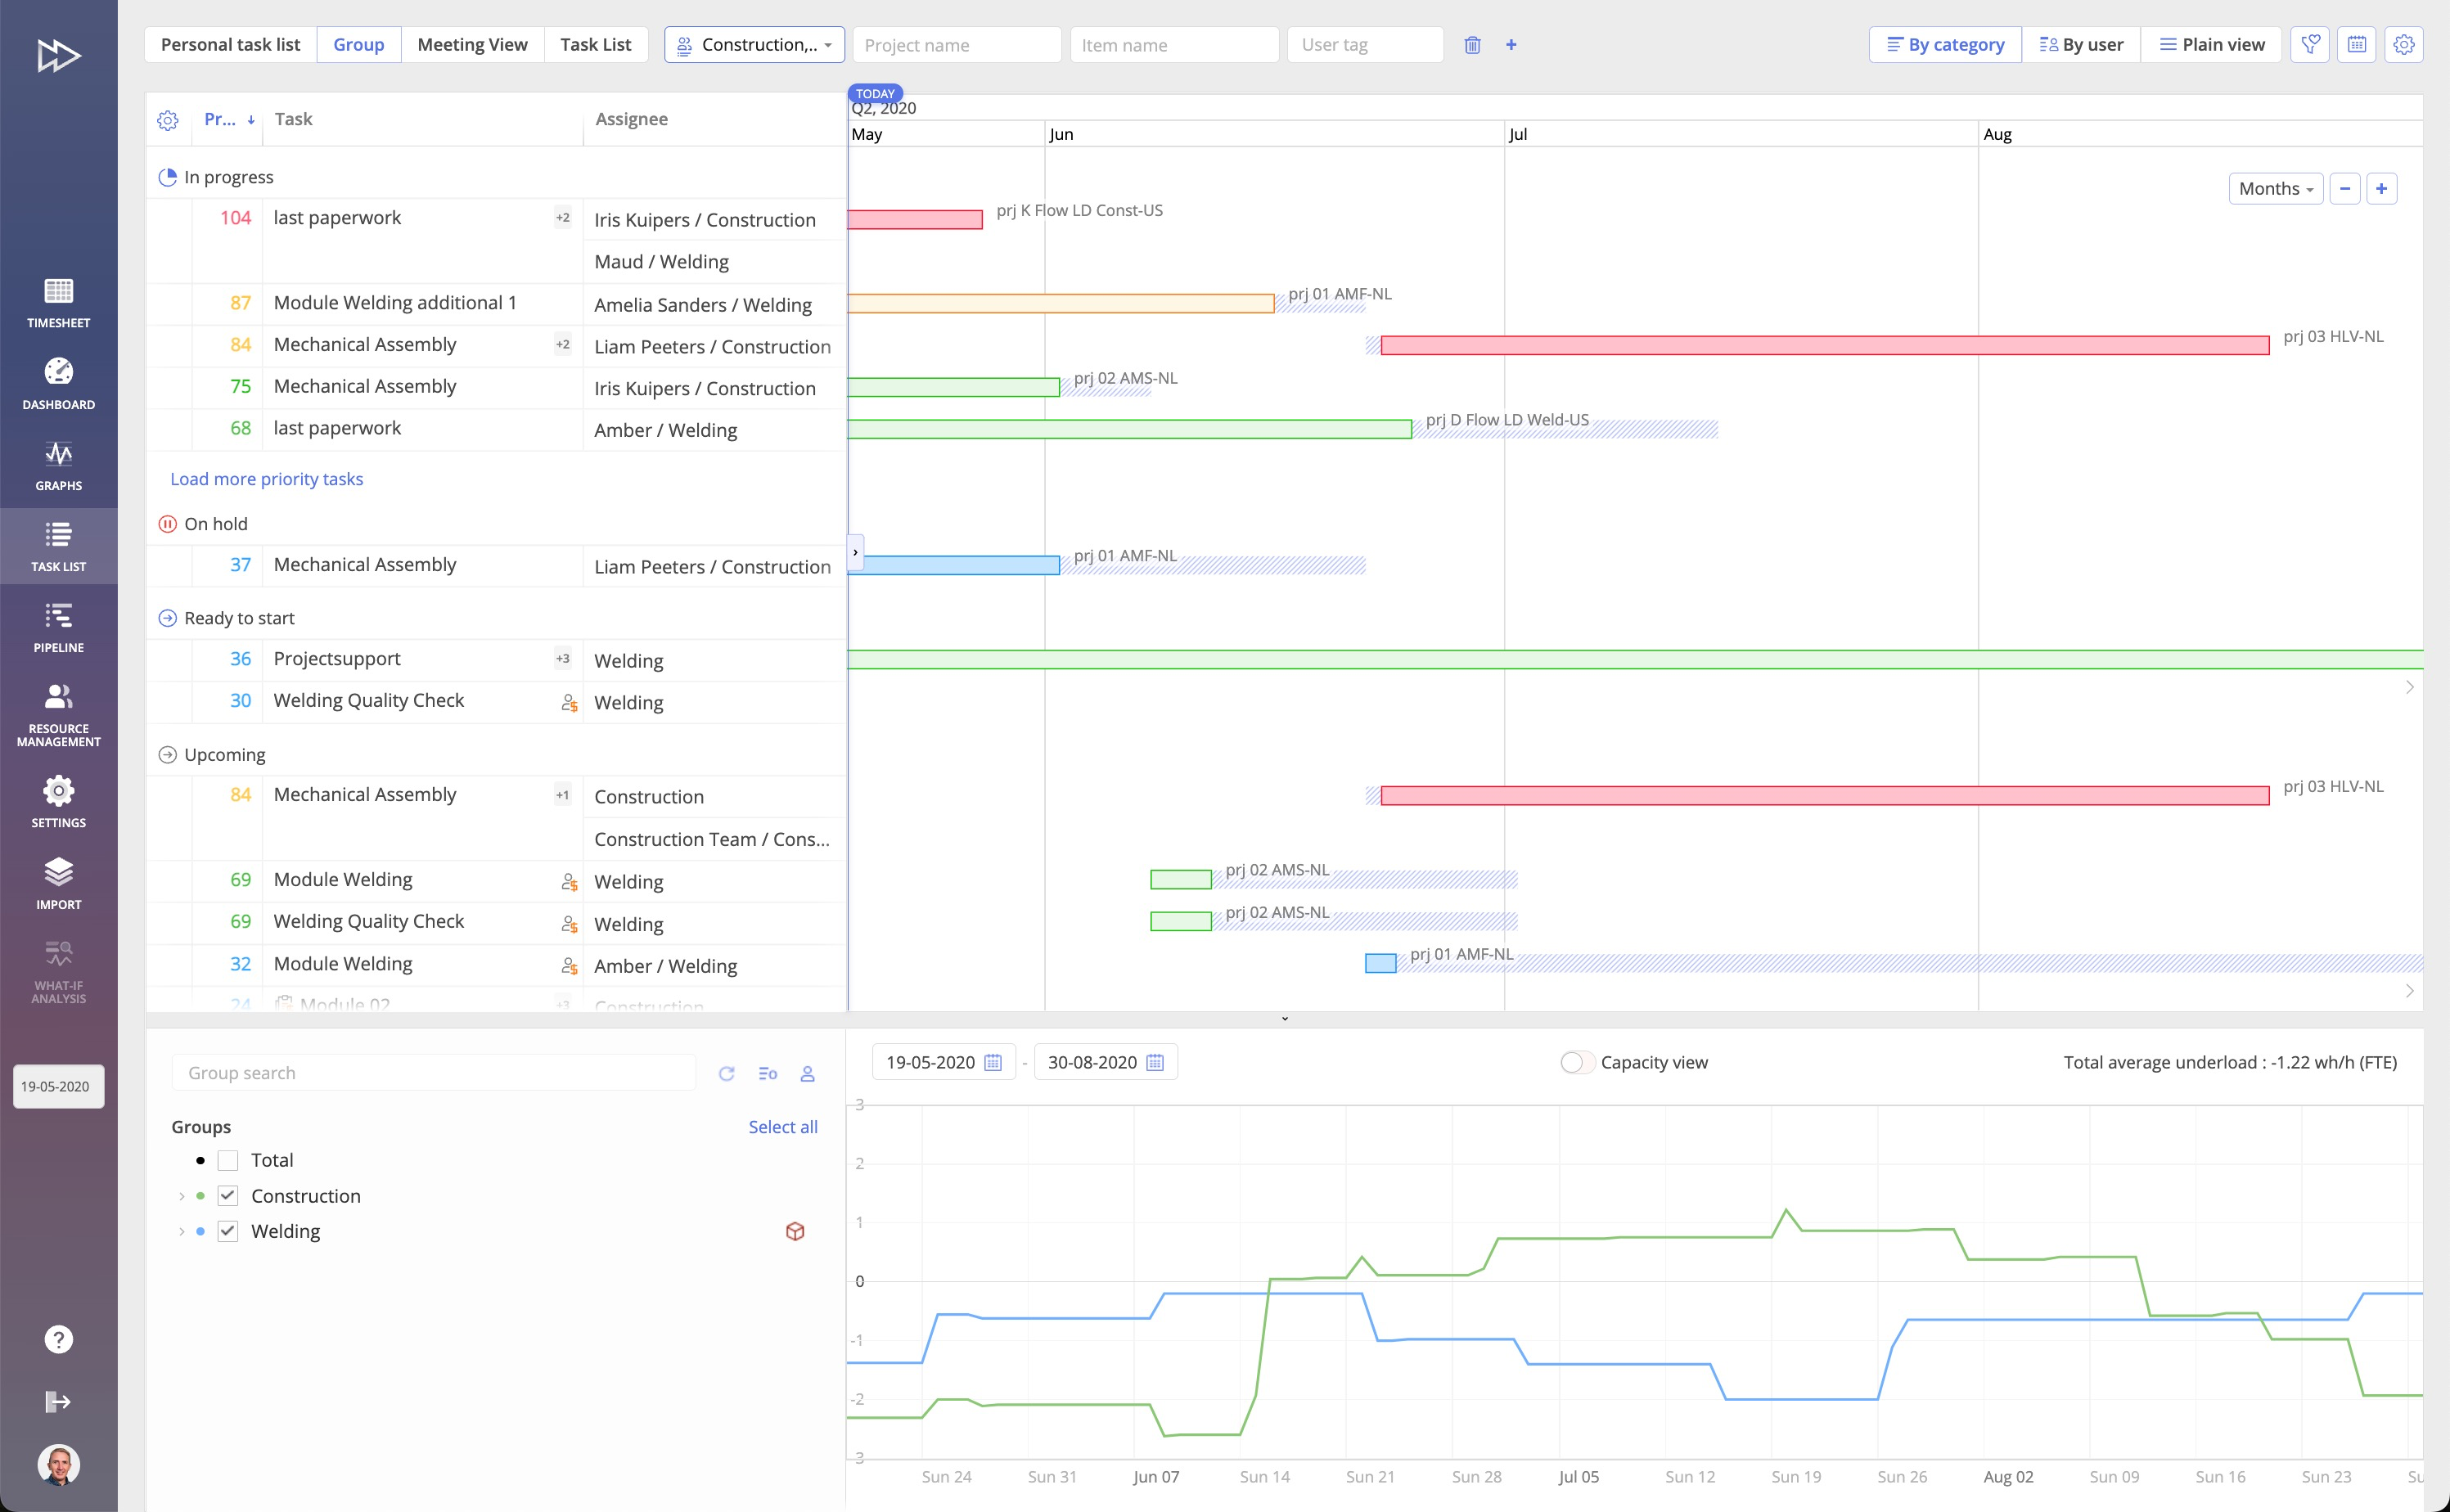 By opening this view, you can see the periods when the tasks should be done. A bar in front of each task shows the time frames, starting with the earliest day (today) when the assignment can be initiated and finishing with the dashed area to show the whole period allotted for the task (ending with the latest finish date possible). You can zoom in and zoom out the time frame to see the task execution periods at different levels (days, weeks, months, quarters, years).