This year has been really fruitful for the Epicflow team and our clients. We have been doing our best to meet our users’ requirements and make their project management life as easy and comfortable as possible thanks to our new features and enhancements. So, let’s take a look at the results of Epicflow’s researchers’ work in 2019.
1. Material Resources
This year, we implemented a feature that helps you control the consumption of materials. It’s another tool at your resource management page. You can add the material group name, measure, amount, rate, and group risk factor in the corresponding fields to have total control of it.
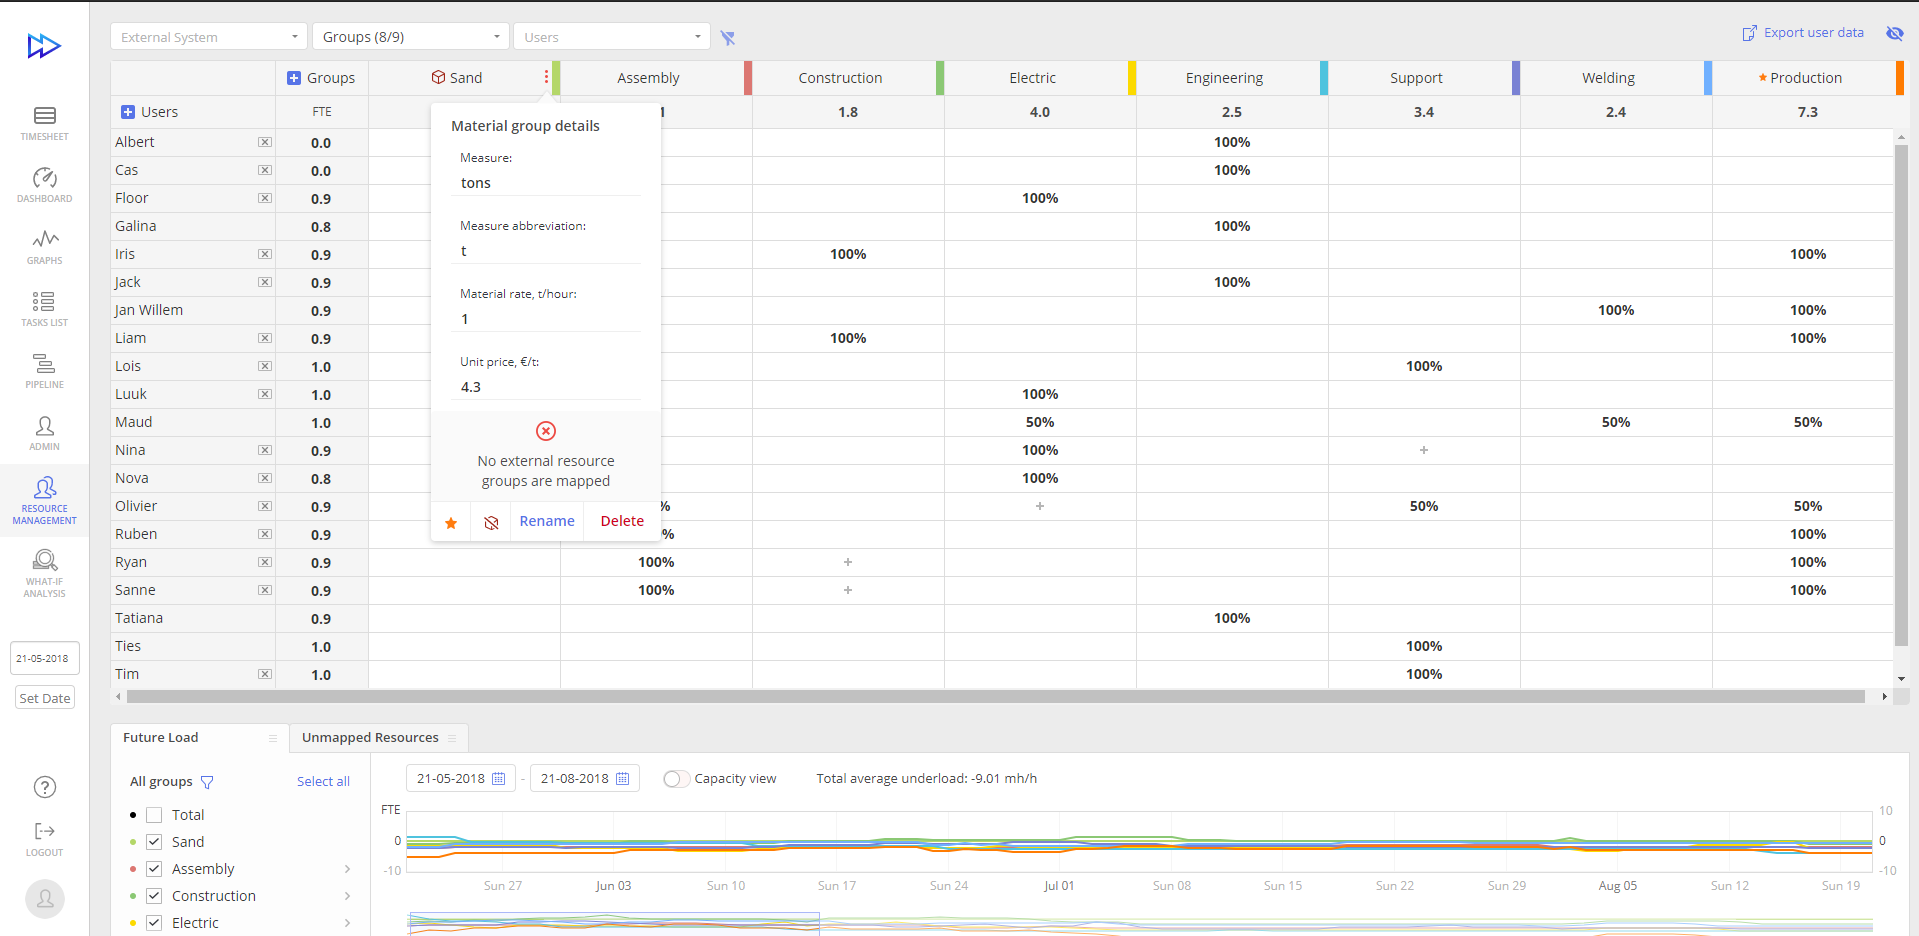
You can also convert any resource group to material and vise versa.
2. Creating Separate Un-Compressible Lead Time Groups
We’ve changed the process of creating Un-Compressible Lead Time Groups to make it similar to the process of creating material groups. Un-compressible lead time means that a task has a fixed duration or requires fixed amount of time, which can’t be sped up by assigning more resources, for example time needed for concrete to become solid. What’s more, now there’s no limit on the number of UCLT groups.
3. Inter-project Relations
To make your planning more efficient and ordered, we’ve added the inter-project relations feature. So now you can share milestones between your projects.
4. Filtering
For easier and more comfortable navigation, we’ve added a filtering function to Pipeline and Gantt chart.
Pipeline Filter
If you want to see certain project-related data in Pipeline, sort out information based on the following filters:
- Priority
- Project name
- Project manager’s name
- Project tag
- Text filter
- Date range
- Assigned groups \\ resources
- Stage
- Tag
- Summary level depiction
- Item Color
Gantt Filter
You can display tasks using the following filters: ‘show all’, ‘selected by a date range’, and ‘last 14 days plus future’.
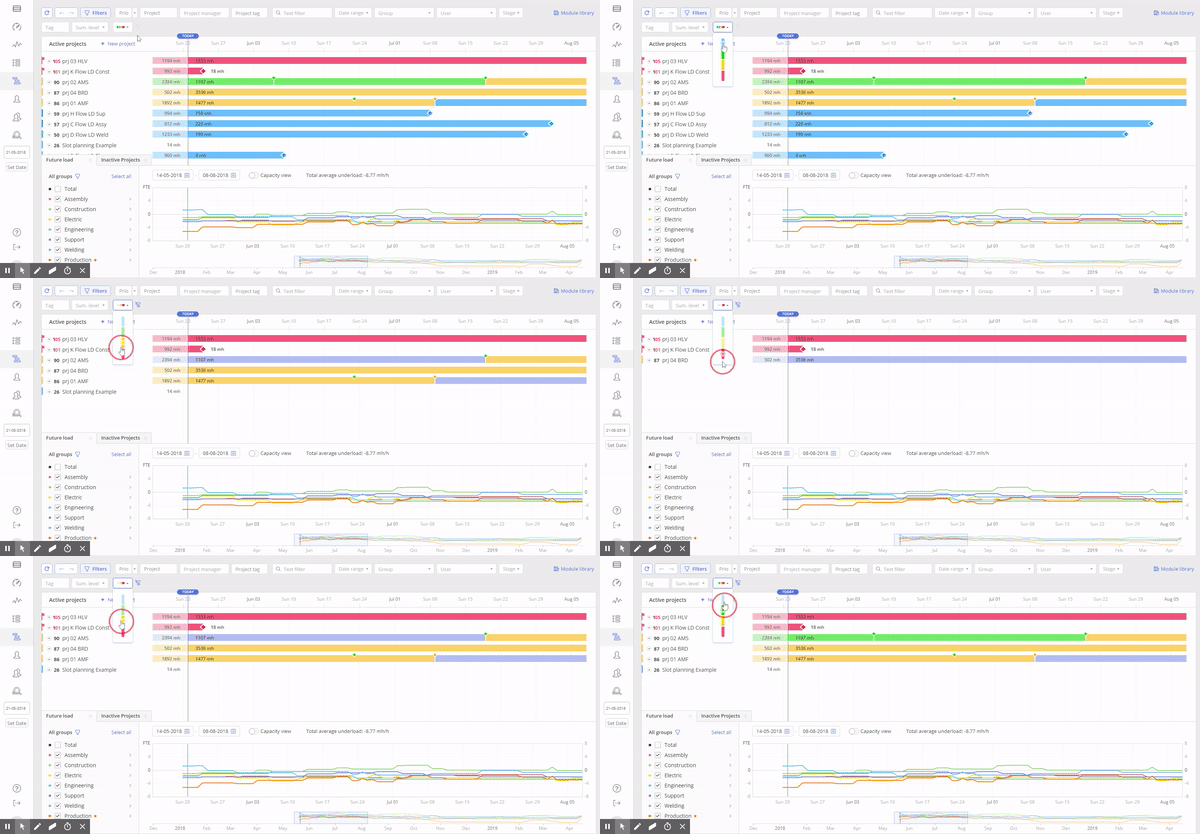
In Epicflow, we use four colors to demonstrate the project priority. Blue and green mean that your projects are moving according to the schedule. Yellow signals about a potential threat, so these projects need your special attention. Red is an indicator of problems in your projects’ progress. To see the projects with particular priorities (blue, green, yellow, and red), apply a color filter in Gannt view.
5. Automatic and Manual Planning
The Auto Planning mode makes the system automatically calculate the order and duration of necessary items.
This year we implemented Manual (Customized) Planning to let you change the duration of tasks and summaries as well as their ordering by yourself. This function is available on the Gantt chart.
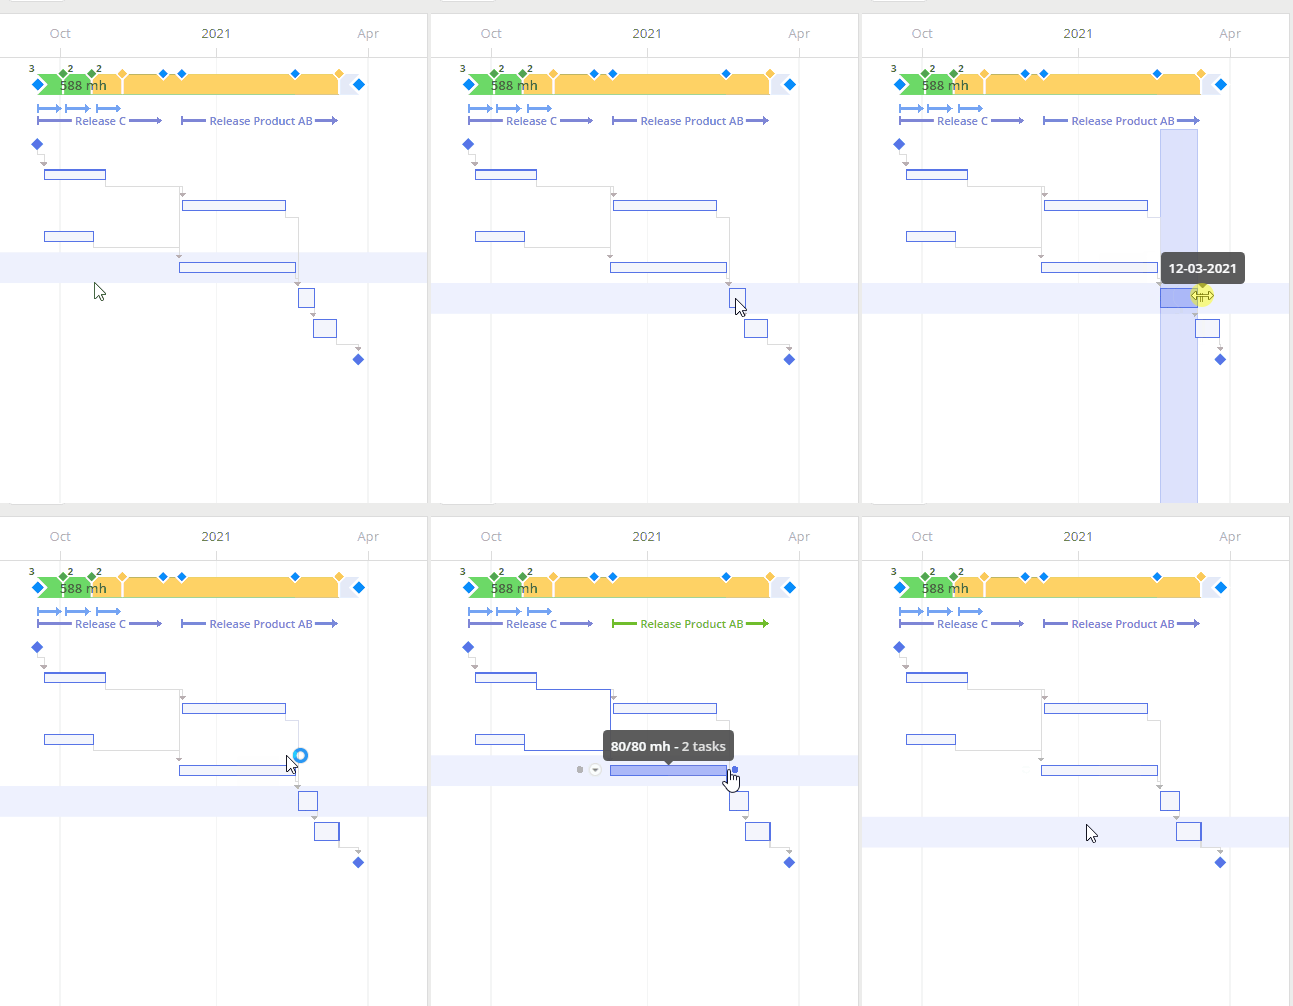
‘Changing Task Duration’
6. Module Library
When managing multiple projects, you may have a lot of similar project elements. To save your time and efforts, we’ve added the Module Library feature that makes it possible to apply typical elements as templates for many projects. So, you can just copy an item and use it in another project instead of creating new ones every time.
7. Quick Edit Mode
It was released in May 2019 as an equivalent of a corresponding MS Project function. When switching to this mode, you can create and edit project-related data in an absolutely easy way with key combinations or using a graphic interface. Here you can also check milestones and their types, create multi-groups, and apply undo/redo actions to tasks.
8. Project and Group Risk Factor
Epicflow users manage their project risks by arranging buffer time. We consider buffer through the prism of a priority coefficient. It’s spare time before the end of the project. You can also define this time manually and prioritize projects according to the risk factor.
Now you can manage project risks by applying a Group Risk Factor function. It measures the risk of the discrepancy between the amount of time allocated for accomplishing tasks and the real time spent by a group of people working on the project. You can add a buffer to a certain project manually if you think it’s needed to complete some tasks. Keep in mind that any changes will result in project priority transformations.
9. Timesheet
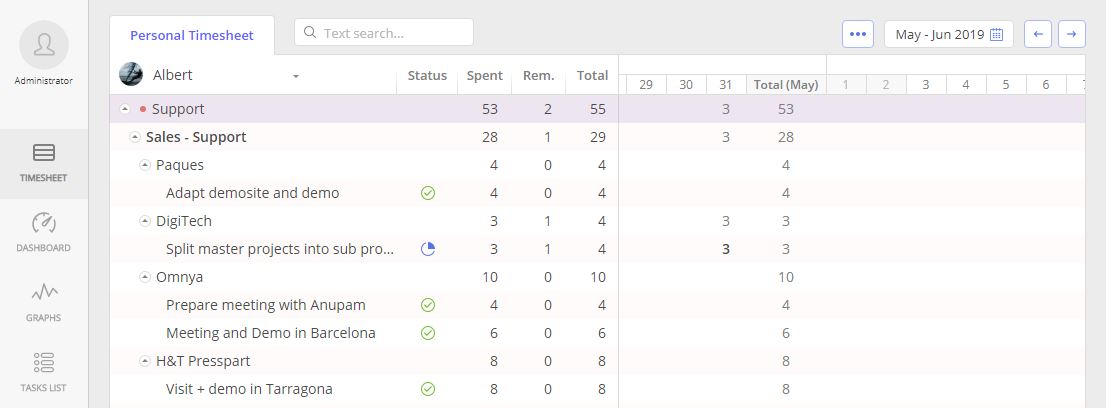
We implemented Timesheet in May 2019 as a tool for analyzing the previous output and its further adjustment. Here you can register and edit your working hours spent on fulfilling a certain task during the day. This function is also useful for project managers as they can get a total overview of the output in the historical timeline and then modify it. There are two columns with assigned tasks ranged by User Groups and Summary items and the produced output on a particular task in the Timeline. You can display the necessary data based on the resource name, resource group or summary, date, or text search.
To correct the output, just choose a date with a date picker or scroll to a top dates line or drag it. There’s an alphabetical username order in the timesheet dropdown list to let you easily find a necessary name. Besides, not only you but also every project team member can correct the logged working hours.
You can make the following corrections in the column display:
- Hide some of the column items,
- Change the order of columns by dragging,
- Set up default settings by clicking ‘Default’ button.
10. Commenting
You can collaborate with your team by using the comment function in the Task card to discuss task-related issues. The system displays comments in chronological order.
11. User Configurations
You can manage settings or apply specific user’s configurations for a newly added user. We’ve added an option of copying settings to a default profile, so you can set them for a newly invited user. Besides, it’s possible to select parameters for assigning to a certain user.
We’ve also designed Bulk Change for Groups, so you can change one resource group to another for several tasks at the same time just in a click.
12. Baseline & Difference
Baseline is the initial project-related data about set up before initiating the project. As a rule, it involves schedule, cost, and scope values.
The Difference parameter shows the way your input is changing over time against the baseline.
Now you can find a ‘baseline’ and ‘difference’ parameters in the following sections:
- Timesheet
- Task Card
- Quick Edit mode
13. Mobile App
Logging In
Log in just by inserting your email and password. Before implementing this enhancement, the logging in was possible only from a PC after getting a QR code and reading it with the mobile app.
My Work Log Page
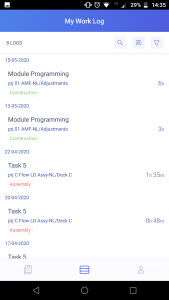
On this page, you can check tasks and working hours registered for their completion.
Material Group
Now you can have charge of the material consumption using your smartphone.
Thank you for being our users, joining us this year or just keeping track of our news or reading our blog. Stay with us and get new insights into project management and remember that your feedback is very welcome.
